Estimated Value: $375,000 - $417,553
3
Beds
2
Baths
1,342
Sq Ft
$300/Sq Ft
Est. Value
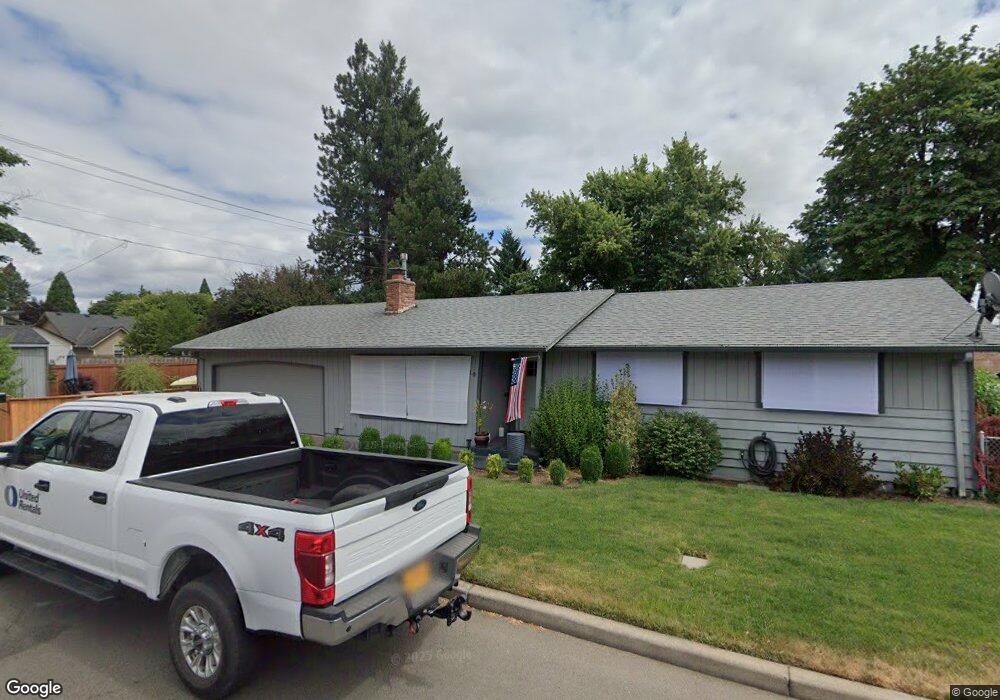
About This Home
This home is located at 210 N Cedar St, Canby, OR 97013 and is currently estimated at $402,638, approximately $300 per square foot. 210 N Cedar St is a home located in Clackamas County with nearby schools including Howard Eccles Elementary School, Baker Prairie Middle School, and Canby High School.
Ownership History
Date
Name
Owned For
Owner Type
Purchase Details
Closed on
Feb 26, 2015
Sold by
Ash Doris L
Bought by
Hess Trevor
Current Estimated Value
Home Financials for this Owner
Home Financials are based on the most recent Mortgage that was taken out on this home.
Original Mortgage
$173,469
Outstanding Balance
$131,732
Interest Rate
3.61%
Mortgage Type
New Conventional
Estimated Equity
$270,906
Purchase Details
Closed on
Nov 10, 2004
Sold by
Crites Richard D and Crites Mary Ann
Bought by
Ash Doris L and Ash Andrew E
Home Financials for this Owner
Home Financials are based on the most recent Mortgage that was taken out on this home.
Original Mortgage
$138,720
Interest Rate
5.99%
Mortgage Type
Purchase Money Mortgage
Purchase Details
Closed on
Sep 30, 1997
Sold by
Kite Robert Wayne and Kite Tommy Gale
Bought by
Davis Venus P
Home Financials for this Owner
Home Financials are based on the most recent Mortgage that was taken out on this home.
Original Mortgage
$64,000
Interest Rate
7.44%
Create a Home Valuation Report for This Property
The Home Valuation Report is an in-depth analysis detailing your home's value as well as a comparison with similar homes in the area
Home Values in the Area
Average Home Value in this Area
Purchase History
| Date | Buyer | Sale Price | Title Company |
|---|---|---|---|
| Hess Trevor | $170,000 | First American | |
| Ash Doris L | $173,400 | Chicago Title Insurance Comp | |
| Davis Venus P | $121,000 | Stewart Title |
Source: Public Records
Mortgage History
| Date | Status | Borrower | Loan Amount |
|---|---|---|---|
| Open | Hess Trevor | $173,469 | |
| Previous Owner | Ash Doris L | $138,720 | |
| Previous Owner | Davis Venus P | $64,000 | |
| Closed | Ash Doris L | $34,680 |
Source: Public Records
Tax History
| Year | Tax Paid | Tax Assessment Tax Assessment Total Assessment is a certain percentage of the fair market value that is determined by local assessors to be the total taxable value of land and additions on the property. | Land | Improvement |
|---|---|---|---|---|
| 2025 | $3,729 | $210,459 | -- | -- |
| 2024 | $3,624 | $204,330 | -- | -- |
| 2023 | $3,624 | $198,379 | $0 | $0 |
| 2022 | $3,333 | $192,601 | $0 | $0 |
| 2021 | $3,210 | $186,992 | $0 | $0 |
| 2020 | $3,153 | $181,546 | $0 | $0 |
| 2019 | $3,002 | $176,259 | $0 | $0 |
| 2018 | $2,935 | $171,125 | $0 | $0 |
| 2017 | $2,861 | $166,141 | $0 | $0 |
| 2016 | $2,765 | $161,302 | $0 | $0 |
Source: Public Records
Map
Nearby Homes
- 589 NW 3rd Ave
- 1198 SW 1st Ave
- 431 SW 3rd Ave
- 795 NW 6th Ave
- 299 SW 3rd Ave
- 625 N Knights Bridge Rd
- 672 S Fir St
- 913 S Fir Ct
- 574 S Ivy St
- 1025 S Fir Ct
- 1250 S Cedar Loop
- 920 N Aspen Ct
- 0 NW 10th Ave
- 1339 S Baywood Ct
- 575 N Locust St
- 318 NE 9th Ave
- 364 NE 9th Ave
- 978 N Alder St
- 340 S Locust St
- 385 SE Township Rd
- 674 NW 2nd Ave
- 215 N Cedar St
- 239 N Cedar St
- 207 N Cedar St
- 247 N Cedar St
- 259 N Cedar St
- 255 N Cedar St Unit 1
- 695 NW 3rd Ave
- 263 N Cedar St
- 677 NW 3rd Ave
- 634 NW 2nd Ave
- 275 N Cedar St
- 649 NW 3rd Ave
- 715 NW 2nd Ave
- 637 NW 3rd Ave
- 759 NW 2nd Ave
- 614 NW 2nd Ave
- 213 N Douglas St
- 159 N Cedar St
- 621 NW 3rd Ave
Your Personal Tour Guide
Ask me questions while you tour the home.