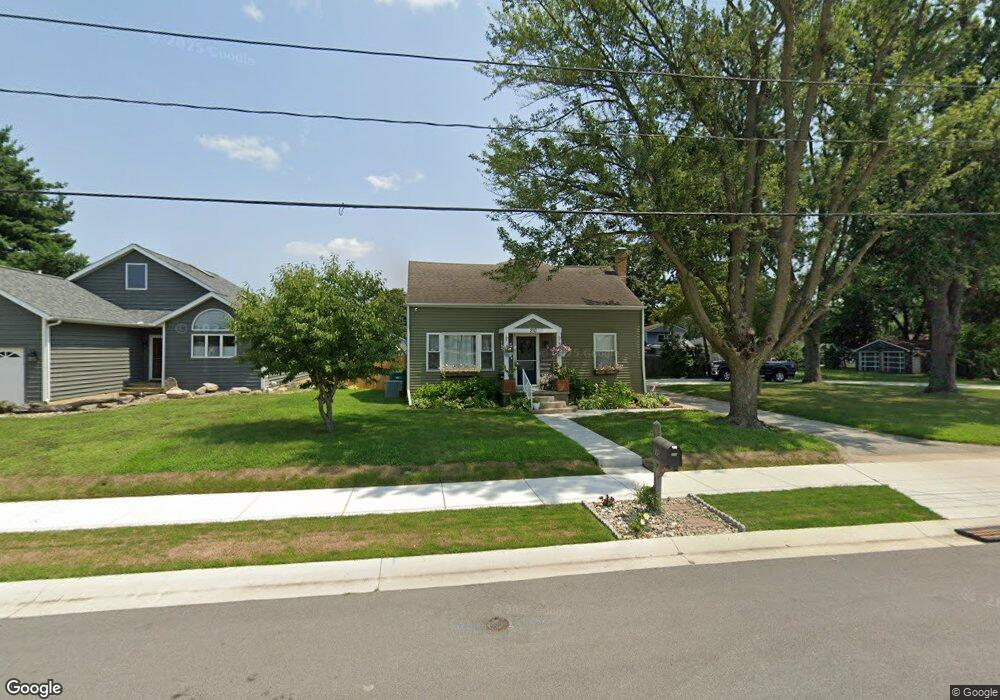
210 N Charles St Mishawaka, IN 46544
Estimated Value: $126,000 - $194,039
3
Beds
1
Bath
1,114
Sq Ft
$147/Sq Ft
Est. Value
About This Home
This home is located at 210 N Charles St, Mishawaka, IN 46544 and is currently estimated at $163,260, approximately $146 per square foot. 210 N Charles St is a home located in St. Joseph County with nearby schools including Twin Branch Elementary School, John J. Young Middle School, and Mishawaka High School.
Ownership History
Date
Name
Owned For
Owner Type
Purchase Details
Closed on
May 15, 2013
Sold by
Vanbruaene John
Bought by
Goodson Seth and Goodson Joy
Current Estimated Value
Home Financials for this Owner
Home Financials are based on the most recent Mortgage that was taken out on this home.
Original Mortgage
$69,530
Outstanding Balance
$49,070
Interest Rate
3.39%
Mortgage Type
FHA
Estimated Equity
$114,190
Purchase Details
Closed on
Mar 1, 2010
Sold by
Vanbruaene John R
Bought by
Goodson Joy
Home Financials for this Owner
Home Financials are based on the most recent Mortgage that was taken out on this home.
Original Mortgage
$74,900
Interest Rate
5.5%
Mortgage Type
Seller Take Back
Purchase Details
Closed on
Sep 11, 2008
Sold by
Stenhofer Edward J
Bought by
Federal National Mortgage Association
Purchase Details
Closed on
Sep 14, 2006
Sold by
Johnson Deborah K
Bought by
Steinhofer Edward J
Create a Home Valuation Report for This Property
The Home Valuation Report is an in-depth analysis detailing your home's value as well as a comparison with similar homes in the area
Home Values in the Area
Average Home Value in this Area
Purchase History
| Date | Buyer | Sale Price | Title Company |
|---|---|---|---|
| Goodson Seth | -- | Meridian Title | |
| Goodson Joy | $75,000 | None Available | |
| Federal National Mortgage Association | $103,012 | None Available | |
| Steinhofer Edward J | -- | Merdian Title Corp |
Source: Public Records
Mortgage History
| Date | Status | Borrower | Loan Amount |
|---|---|---|---|
| Open | Goodson Seth | $69,530 | |
| Previous Owner | Goodson Joy | $74,900 |
Source: Public Records
Tax History Compared to Growth
Tax History
| Year | Tax Paid | Tax Assessment Tax Assessment Total Assessment is a certain percentage of the fair market value that is determined by local assessors to be the total taxable value of land and additions on the property. | Land | Improvement |
|---|---|---|---|---|
| 2024 | $1,282 | $109,900 | $34,800 | $75,100 |
| 2023 | $1,282 | $111,900 | $34,800 | $77,100 |
| 2022 | $1,247 | $111,900 | $34,800 | $77,100 |
| 2021 | $986 | $90,300 | $19,600 | $70,700 |
| 2020 | $1,066 | $92,000 | $19,600 | $72,400 |
| 2019 | $1,247 | $106,000 | $25,100 | $80,900 |
| 2018 | $1,234 | $92,600 | $21,900 | $70,700 |
| 2017 | $1,291 | $92,000 | $21,900 | $70,100 |
| 2016 | $1,052 | $85,600 | $21,900 | $63,700 |
| 2014 | $667 | $67,600 | $17,500 | $50,100 |
Source: Public Records
Map
Nearby Homes
- 3914 Vistula Rd
- 4207 Lincolnway E
- 12340 Lincoln Way E
- 3751 Terry Ln
- 135 Ray St
- 318 Terry Ln
- 3623 Vistula Rd
- 123 Oakside Ave
- 3820 Cottage Ave
- 4326 Cassell Ave
- 4607 Rivers Edge Dr
- 157 Manor Dr
- 705 Vistula Terrace Unit 1
- 5116 Bankside Ct
- 514 Ventura Dr
- 3362 York St
- 56400 Francis Ave
- V/L Jefferson Blvd
- 624 Windy Cove Ct
- 2828 Lincolnway E
- 212 N Charles St
- 214 N Charles St
- 131 Barrows Ct
- 211 Barrows Ct
- 201 Barrows Ct
- 218 N Charles St
- 215 Barrows Ct
- 220 N Charles St
- 127 Barrows Ct
- 120 N Charles St
- 221 Barrows Ct
- 121 Barrows Ct
- 228 N Charles St
- 116 N Charles St
- 207 N Elder St
- 119 Barrows Ct
- 213 N Elder St
- 201 N Elder St
- 230 N Charles St
- 219 N Elder St