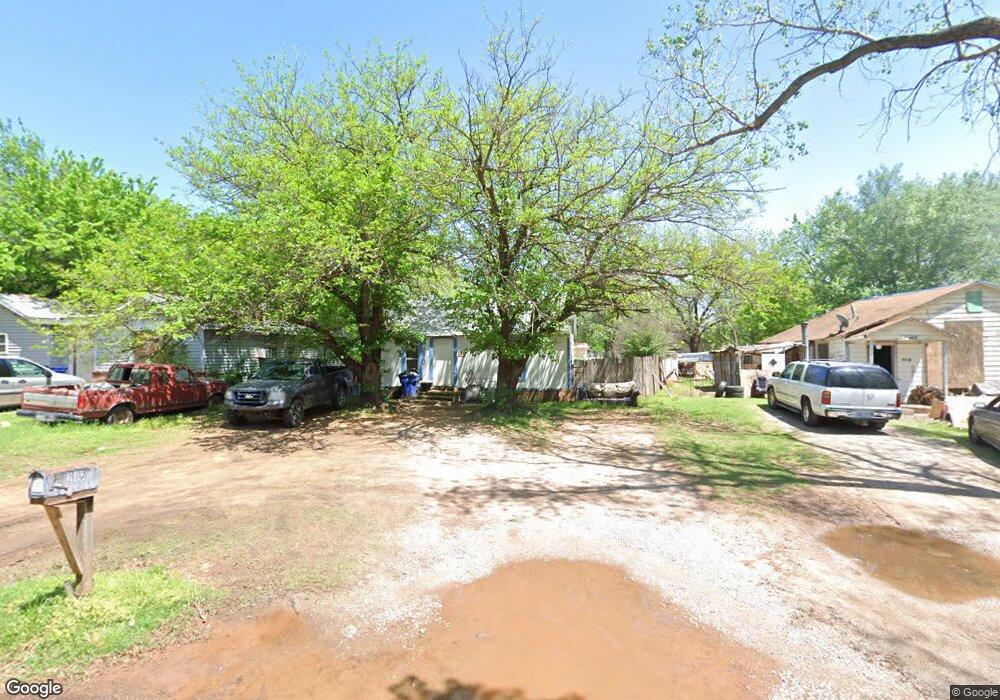
210 N E St Duncan, OK 73533
Estimated Value: $33,000 - $58,000
1
Bed
1
Bath
672
Sq Ft
$65/Sq Ft
Est. Value
About This Home
This home is located at 210 N E St, Duncan, OK 73533 and is currently estimated at $43,408, approximately $64 per square foot. 210 N E St is a home located in Stephens County with nearby schools including Woodrow Wilson Elementary School, Duncan Middle School, and Duncan High School.
Ownership History
Date
Name
Owned For
Owner Type
Purchase Details
Closed on
Mar 31, 2025
Sold by
Bryant John Dean and Bryant Kimberly
Bought by
Faulk Sherri Dawn and Heary Jeffry A
Current Estimated Value
Purchase Details
Closed on
Jun 22, 2006
Sold by
Arvest Bank
Bought by
Bryant John Dean
Home Financials for this Owner
Home Financials are based on the most recent Mortgage that was taken out on this home.
Original Mortgage
$9,000
Interest Rate
6.56%
Mortgage Type
Purchase Money Mortgage
Purchase Details
Closed on
May 10, 2002
Sold by
Mccullough Gale and Mccullough Linda
Purchase Details
Closed on
Nov 16, 1994
Sold by
Thompson Billie L
Create a Home Valuation Report for This Property
The Home Valuation Report is an in-depth analysis detailing your home's value as well as a comparison with similar homes in the area
Purchase History
| Date | Buyer | Sale Price | Title Company |
|---|---|---|---|
| Faulk Sherri Dawn | $5,000 | None Listed On Document | |
| Faulk Sherri Dawn | $5,000 | None Listed On Document | |
| Bryant John Dean | $8,000 | None Available | |
| -- | $8,000 | -- | |
| -- | $2,500 | -- |
Source: Public Records
Mortgage History
| Date | Status | Borrower | Loan Amount |
|---|---|---|---|
| Previous Owner | Bryant John Dean | $9,000 |
Source: Public Records
Tax History
| Year | Tax Paid | Tax Assessment Tax Assessment Total Assessment is a certain percentage of the fair market value that is determined by local assessors to be the total taxable value of land and additions on the property. | Land | Improvement |
|---|---|---|---|---|
| 2025 | $121 | $1,436 | $193 | $1,243 |
| 2024 | $76 | $897 | $193 | $704 |
| 2023 | $76 | $897 | $193 | $704 |
| 2022 | $69 | $814 | $193 | $621 |
| 2021 | $130 | $1,535 | $193 | $1,342 |
| 2020 | $120 | $1,392 | $193 | $1,199 |
| 2019 | $115 | $1,326 | $193 | $1,133 |
| 2018 | $112 | $1,263 | $193 | $1,070 |
| 2017 | $104 | $1,273 | $193 | $1,080 |
| 2016 | $98 | $1,155 | $193 | $962 |
| 2015 | $116 | $1,155 | $193 | $962 |
| 2014 | $116 | $1,461 | $114 | $1,347 |
Source: Public Records
Map
Nearby Homes
Your Personal Tour Guide
Ask me questions while you tour the home.