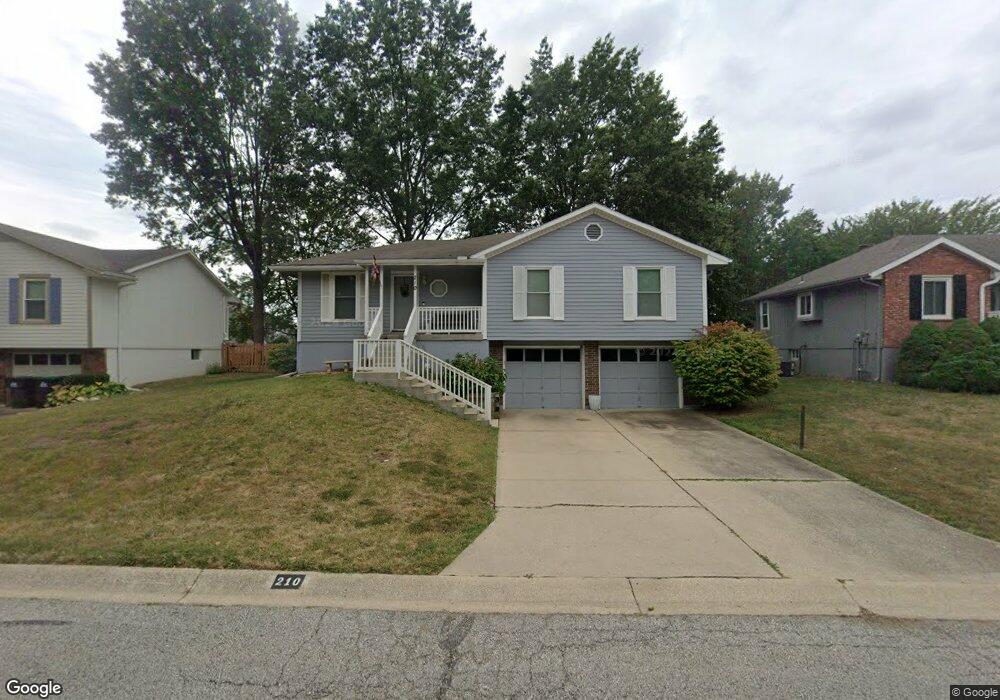
210 NE Leann Dr Blue Springs, MO 64014
Estimated Value: $285,000 - $304,000
3
Beds
2
Baths
1,242
Sq Ft
$237/Sq Ft
Est. Value
About This Home
This home is located at 210 NE Leann Dr, Blue Springs, MO 64014 and is currently estimated at $294,684, approximately $237 per square foot. 210 NE Leann Dr is a home located in Jackson County with nearby schools including Lucy Franklin Elementary School, Brittany Hill Middle School, and Blue Springs High School.
Ownership History
Date
Name
Owned For
Owner Type
Purchase Details
Closed on
Mar 13, 2003
Sold by
Universal Mortgage Corp
Bought by
Hud
Current Estimated Value
Purchase Details
Closed on
Mar 5, 2003
Sold by
Miller Jerry and Miller Michelle L
Bought by
Universal Mortgage Corp
Purchase Details
Closed on
Jul 27, 2000
Sold by
Johnson Gary L
Bought by
Miller Jerry and Miller Michelle
Home Financials for this Owner
Home Financials are based on the most recent Mortgage that was taken out on this home.
Original Mortgage
$114,059
Interest Rate
8.23%
Mortgage Type
FHA
Purchase Details
Closed on
Jun 11, 1996
Sold by
Harris Todd A and Harris Angela D
Bought by
Johnson Gary L
Home Financials for this Owner
Home Financials are based on the most recent Mortgage that was taken out on this home.
Original Mortgage
$72,500
Interest Rate
7.75%
Mortgage Type
Purchase Money Mortgage
Create a Home Valuation Report for This Property
The Home Valuation Report is an in-depth analysis detailing your home's value as well as a comparison with similar homes in the area
Home Values in the Area
Average Home Value in this Area
Purchase History
| Date | Buyer | Sale Price | Title Company |
|---|---|---|---|
| Hud | -- | -- | |
| Universal Mortgage Corp | $132,157 | -- | |
| Miller Jerry | -- | Columbian National Title | |
| Johnson Gary L | -- | Old Republic Title Company |
Source: Public Records
Mortgage History
| Date | Status | Borrower | Loan Amount |
|---|---|---|---|
| Previous Owner | Miller Jerry | $114,059 | |
| Previous Owner | Johnson Gary L | $72,500 |
Source: Public Records
Tax History Compared to Growth
Tax History
| Year | Tax Paid | Tax Assessment Tax Assessment Total Assessment is a certain percentage of the fair market value that is determined by local assessors to be the total taxable value of land and additions on the property. | Land | Improvement |
|---|---|---|---|---|
| 2025 | $3,787 | $41,460 | $6,502 | $34,958 |
| 2024 | $3,714 | $46,415 | $7,535 | $38,880 |
| 2023 | $3,714 | $46,415 | $6,996 | $39,419 |
| 2022 | $2,838 | $31,350 | $6,156 | $25,194 |
| 2021 | $2,836 | $31,350 | $6,156 | $25,194 |
| 2020 | $2,660 | $29,911 | $6,156 | $23,755 |
| 2019 | $2,572 | $29,911 | $6,156 | $23,755 |
| 2018 | $2,306 | $25,822 | $3,525 | $22,297 |
| 2017 | $2,243 | $25,822 | $3,525 | $22,297 |
| 2016 | $2,243 | $25,175 | $3,420 | $21,755 |
| 2014 | $2,029 | $22,707 | $3,416 | $19,291 |
Source: Public Records
Map
Nearby Homes
- 105 NE Leann Dr
- 404 NE Lee Dr
- 2400 NW 1st St
- 2515 NE Springbrook St
- 311 NE Bridge Place
- 1914 NE Grant Cir
- 517 NE Johnston Dr
- 2615 NE Springbrook St
- 280 NW Beau Dr
- 2323 NW Acorn Dr
- 1912 NW Manor Dr
- 816 NE Mary Ct
- 607 NE Field Creek Dr
- 521 NE Hans Dr
- 2105 NW 5th St
- 420 NE Golfview Dr
- 2417 NE Quail Walk Trail
- 2012 NE Adams Dairy Rd
- 204 NW Golfview Dr
- 1320 NE Quail Walk Dr
- 206 NE Leann Dr
- 214 NE Leann Dr
- 302 NE Leann Dr
- 202 NE Leann Dr
- 249 NE Chateau Dr
- 2300 NE 2nd St
- 253 NE Chateau Dr
- 2303 NE 3rd St
- 126 NE Leann Dr
- 241 NE Chateau Dr
- 306 NE Leann Dr
- 2304 NE 2nd St
- 2307 NE 3rd St
- 261 NE Chateau Dr
- 123 NE Leann Dr
- 237 NE Chateau Dr
- 122 NE Leann Dr
- 2308 NE 2nd St
- 310 NE Leann Dr
- 2307 NE 2nd St