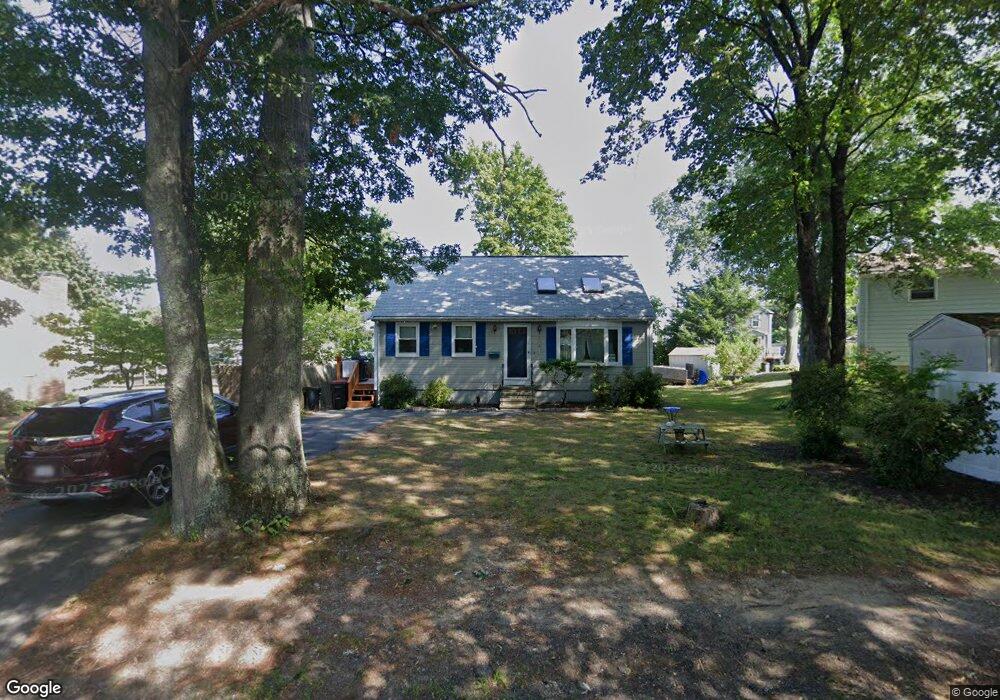
210 North Ave Brockton, MA 02302
Montello NeighborhoodEstimated Value: $509,355 - $546,000
2
Beds
2
Baths
1,300
Sq Ft
$404/Sq Ft
Est. Value
About This Home
This home is located at 210 North Ave, Brockton, MA 02302 and is currently estimated at $524,839, approximately $403 per square foot. 210 North Ave is a home located in Plymouth County with nearby schools including Brookfield Elementary School, Mary E. Baker Elementary School, and Downey Elementary School.
Ownership History
Date
Name
Owned For
Owner Type
Purchase Details
Closed on
Nov 29, 2004
Sold by
Kush Rt and Khoshabjian
Bought by
Arzeno Felipe L and Duggan Aileen B
Current Estimated Value
Home Financials for this Owner
Home Financials are based on the most recent Mortgage that was taken out on this home.
Original Mortgage
$218,320
Interest Rate
5.75%
Mortgage Type
Purchase Money Mortgage
Purchase Details
Closed on
Mar 29, 1993
Sold by
Mekjian Edward R
Bought by
Kush Rt
Create a Home Valuation Report for This Property
The Home Valuation Report is an in-depth analysis detailing your home's value as well as a comparison with similar homes in the area
Home Values in the Area
Average Home Value in this Area
Purchase History
| Date | Buyer | Sale Price | Title Company |
|---|---|---|---|
| Arzeno Felipe L | $272,900 | -- | |
| Kush Rt | $93,000 | -- |
Source: Public Records
Mortgage History
| Date | Status | Borrower | Loan Amount |
|---|---|---|---|
| Open | Kush Rt | $204,000 | |
| Closed | Kush Rt | $218,320 | |
| Closed | Kush Rt | $40,935 | |
| Previous Owner | Kush Rt | $81,500 |
Source: Public Records
Tax History Compared to Growth
Tax History
| Year | Tax Paid | Tax Assessment Tax Assessment Total Assessment is a certain percentage of the fair market value that is determined by local assessors to be the total taxable value of land and additions on the property. | Land | Improvement |
|---|---|---|---|---|
| 2025 | $5,021 | $414,600 | $143,700 | $270,900 |
| 2024 | $4,967 | $413,200 | $143,700 | $269,500 |
| 2023 | $4,518 | $348,100 | $108,300 | $239,800 |
| 2022 | $4,317 | $309,000 | $98,300 | $210,700 |
| 2021 | $4,148 | $286,100 | $90,100 | $196,000 |
| 2020 | $4,095 | $270,300 | $86,600 | $183,700 |
| 2019 | $4,003 | $257,600 | $79,700 | $177,900 |
| 2018 | $3,402 | $211,800 | $79,700 | $132,100 |
| 2017 | $3,165 | $196,600 | $79,700 | $116,900 |
| 2016 | $3,304 | $190,300 | $76,000 | $114,300 |
| 2015 | $3,029 | $166,900 | $76,000 | $90,900 |
| 2014 | $2,977 | $164,200 | $76,000 | $88,200 |
Source: Public Records
Map
Nearby Homes