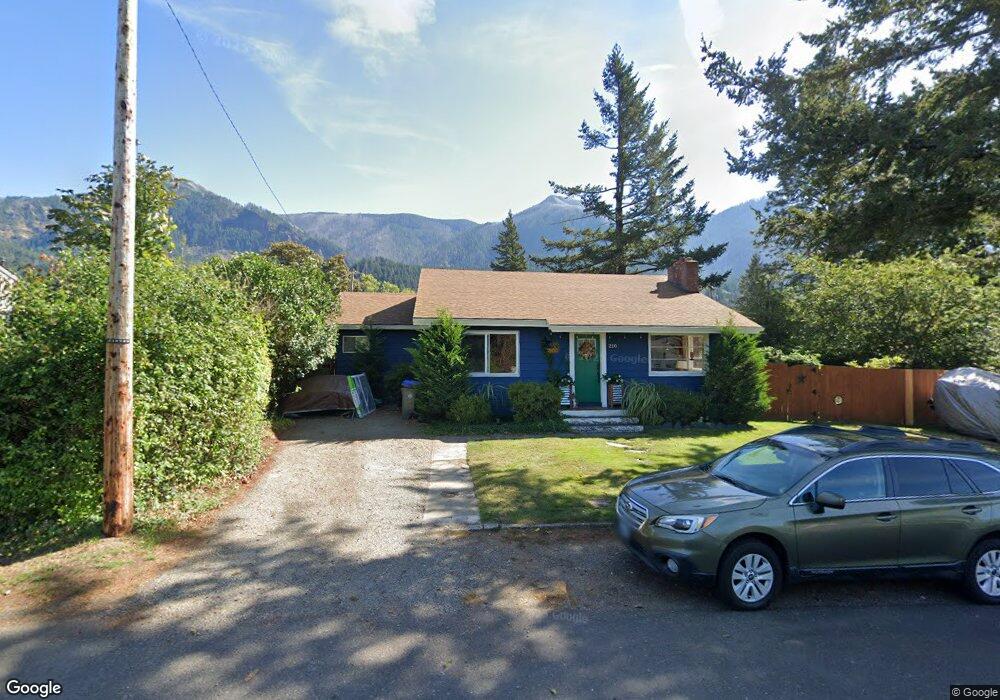
210 NW Walnut St Cascade Locks, OR 97014
Estimated Value: $347,303 - $392,000
2
Beds
1
Bath
1,568
Sq Ft
$236/Sq Ft
Est. Value
About This Home
This home is located at 210 NW Walnut St, Cascade Locks, OR 97014 and is currently estimated at $369,652, approximately $235 per square foot. 210 NW Walnut St is a home located in Hood River County with nearby schools including Cascade Locks School, Hood River Middle School, and Hood River Valley High School.
Ownership History
Date
Name
Owned For
Owner Type
Purchase Details
Closed on
Nov 16, 2018
Sold by
Wells Carlyn R and Wells Brandon L
Bought by
Wells Carlyn R and Wells Brandon L
Current Estimated Value
Home Financials for this Owner
Home Financials are based on the most recent Mortgage that was taken out on this home.
Original Mortgage
$204,100
Outstanding Balance
$175,647
Interest Rate
4%
Mortgage Type
Adjustable Rate Mortgage/ARM
Estimated Equity
$194,005
Purchase Details
Closed on
Jun 27, 2016
Sold by
Fox Nathan P and Fox Rechel J
Bought by
Welen Carlyn R and Wells Brandon L
Home Financials for this Owner
Home Financials are based on the most recent Mortgage that was taken out on this home.
Original Mortgage
$204,000
Interest Rate
3.58%
Mortgage Type
New Conventional
Create a Home Valuation Report for This Property
The Home Valuation Report is an in-depth analysis detailing your home's value as well as a comparison with similar homes in the area
Purchase History
| Date | Buyer | Sale Price | Title Company |
|---|---|---|---|
| Wells Carlyn R | -- | Chicago Title | |
| Welen Carlyn R | $216,000 | Amerititle |
Source: Public Records
Mortgage History
| Date | Status | Borrower | Loan Amount |
|---|---|---|---|
| Open | Wells Carlyn R | $204,100 | |
| Closed | Welen Carlyn R | $204,000 |
Source: Public Records
Tax History
| Year | Tax Paid | Tax Assessment Tax Assessment Total Assessment is a certain percentage of the fair market value that is determined by local assessors to be the total taxable value of land and additions on the property. | Land | Improvement |
|---|---|---|---|---|
| 2025 | $1,996 | $136,020 | $70,120 | $65,900 |
| 2024 | $1,910 | $132,060 | $68,080 | $63,980 |
| 2023 | $1,910 | $128,220 | $66,090 | $62,130 |
| 2022 | $1,752 | $124,490 | $41,570 | $82,920 |
| 2021 | $1,707 | $120,870 | $40,360 | $80,510 |
| 2020 | $1,640 | $117,350 | $39,190 | $78,160 |
| 2019 | $1,521 | $113,940 | $38,050 | $75,890 |
| 2018 | $1,534 | $110,630 | $36,940 | $73,690 |
| 2017 | $1,495 | $107,410 | $35,860 | $71,550 |
| 2016 | $1,418 | $104,290 | $34,820 | $69,470 |
| 2015 | $1,311 | $101,260 | $33,810 | $67,450 |
| 2014 | $1,417 | $98,320 | $32,820 | $65,500 |
| 2013 | $1,294 | $95,460 | $31,860 | $63,600 |
Source: Public Records
Map
Nearby Homes
- 14 NW Lakeside Dr
- 0 Dry Creek Rd
- 820 SE Frontage Rd
- 922 SW Spelling Place
- 725 SW Moody Ave
- 935 Spelling Place Unit 17
- 951 Spelling Place Unit 14
- 245 SW Sternwheeler Dr Unit 24
- 1153 Chinookan Dr
- 1172 Chinookan Dr
- 541 NW Vancouver Ave
- 41 NW Lasher St Unit C4
- 0 Frontage Rd
- 438 NW Roselawn St
- 403 NW Roselawn St
- 79 NW Lasher St
- 1090 SW Briggs St
- 1225 SW Ryan Allen Rd
- 0 School St Unit 761845716
- 344 Lutheran Church Rd
- 220 NW Walnut St
- 215 NW Walnut St
- 200 NW Walnut St
- 215 NE Forest Ln
- 205 NE Walnut St
- 5 NE Cragmont Ave
- 225 NE Walnut St
- 205 Forest Ln
- 210 NE Riverview Dr
- 210 Riverview
- 200 Riverview
- 200 NE Riverview Dr
- 105 NE Crest Dr
- 22 Cragmont
- 220 NE Riverview Dr
- 305 NE Forest Ln
- 35 NE Crest Dr
- 115 NE Crest Dr
- 25 NW Crest Dr
Your Personal Tour Guide
Ask me questions while you tour the home.