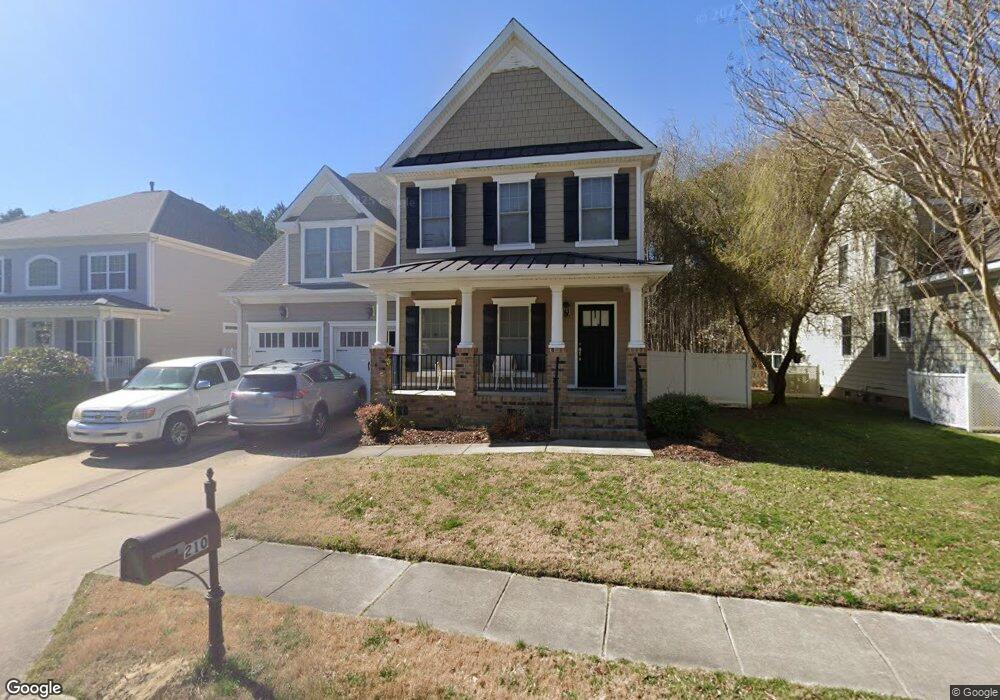
210 Preservation Reach Unit 42 Chesapeake, VA 23320
Greenbrier West NeighborhoodEstimated Value: $613,207 - $675,000
3
Beds
3
Baths
2,433
Sq Ft
$267/Sq Ft
Est. Value
About This Home
This home is located at 210 Preservation Reach Unit 42, Chesapeake, VA 23320 and is currently estimated at $649,802, approximately $267 per square foot. 210 Preservation Reach Unit 42 is a home located in Chesapeake City with nearby schools including B.M. Williams Primary School, Crestwood Intermediate School, and Crestwood Middle School.
Ownership History
Date
Name
Owned For
Owner Type
Purchase Details
Closed on
Jan 15, 2021
Sold by
Sadler Edward R and Sadler Kim
Bought by
Simon Diana C
Current Estimated Value
Home Financials for this Owner
Home Financials are based on the most recent Mortgage that was taken out on this home.
Original Mortgage
$441,849
Outstanding Balance
$394,352
Interest Rate
2.71%
Mortgage Type
New Conventional
Estimated Equity
$255,450
Purchase Details
Closed on
Oct 21, 2019
Sold by
Sadler Edward R and Sadler Kim A
Bought by
Sadler Edward R and Sadler Kim
Purchase Details
Closed on
Feb 18, 2011
Sold by
Sadler Building Corp
Bought by
Sadler Edward A
Home Financials for this Owner
Home Financials are based on the most recent Mortgage that was taken out on this home.
Original Mortgage
$322,500
Interest Rate
4.77%
Mortgage Type
Construction
Create a Home Valuation Report for This Property
The Home Valuation Report is an in-depth analysis detailing your home's value as well as a comparison with similar homes in the area
Home Values in the Area
Average Home Value in this Area
Purchase History
| Date | Buyer | Sale Price | Title Company |
|---|---|---|---|
| Simon Diana C | $450,000 | Attorney | |
| Sadler Edward R | -- | None Available | |
| Sadler Edward A | $386,500 | -- |
Source: Public Records
Mortgage History
| Date | Status | Borrower | Loan Amount |
|---|---|---|---|
| Open | Simon Diana C | $441,849 | |
| Previous Owner | Sadler Edward A | $322,500 |
Source: Public Records
Tax History Compared to Growth
Tax History
| Year | Tax Paid | Tax Assessment Tax Assessment Total Assessment is a certain percentage of the fair market value that is determined by local assessors to be the total taxable value of land and additions on the property. | Land | Improvement |
|---|---|---|---|---|
| 2025 | $6,213 | $634,400 | $215,000 | $419,400 |
| 2024 | $6,213 | $615,100 | $210,000 | $405,100 |
| 2023 | $5,398 | $585,200 | $210,000 | $375,200 |
| 2022 | $5,130 | $507,900 | $180,000 | $327,900 |
| 2021 | $4,877 | $464,500 | $170,000 | $294,500 |
| 2020 | $4,813 | $458,400 | $165,000 | $293,400 |
| 2019 | $4,729 | $450,400 | $165,000 | $285,400 |
| 2018 | $4,396 | $377,300 | $125,000 | $252,300 |
| 2017 | $3,962 | $377,300 | $125,000 | $252,300 |
| 2016 | $3,962 | $377,300 | $125,000 | $252,300 |
| 2015 | $4,052 | $385,900 | $120,000 | $265,900 |
| 2014 | $4,052 | $385,900 | $120,000 | $265,900 |
Source: Public Records
Map
Nearby Homes
- 223 Wildlife Trace
- 308 Wildlife Trace
- 335 Preservation Reach
- 401 Preservation Reach
- 339 Conservation Crossing
- 423 Seahorse Run
- 609 Sail Fish Quay
- 605 Sail Fish Quay
- 717 Creekside Crescent
- 705 Creekside Crescent
- 336 Esplanade Place
- 725 Inlet Quay Unit C
- 401 Camberley Way Unit A
- 404 River Arch Dr
- 1 Sandy Point Ln Unit 218
- 960 Bells Mill Rd
- 2302 Willow Point Arch
- 705 Seagrass Reach
- 120 Taxus St
- 549 Old Oak Grove Rd
- 210 Preservation Reach
- 208 Preservation Reach
- 212 Preservation Reach
- 212 Preservation Reach Unit 43
- 212 Preservation Reach Loop
- 214 Preservation Reach
- 216 Preservation Reach Unit 38
- 206 Preservation Reach
- 209 Preservation Reach
- 211 Preservation Reach Unit 36
- 215 Preservation Reach Unit 38
- 201 Preservation Reach
- 213 Preservation Reach
- 213 Preservation Reach Unit 37
- 201 Preservation Reach Loop
- 204 Preservation Reach
- 106 Preservation Reach Unit 4
- 107 Preservation Reach Unit 35
- 103 Preservation Reach Unit 33
- 104 Preservation Reach Unit 40