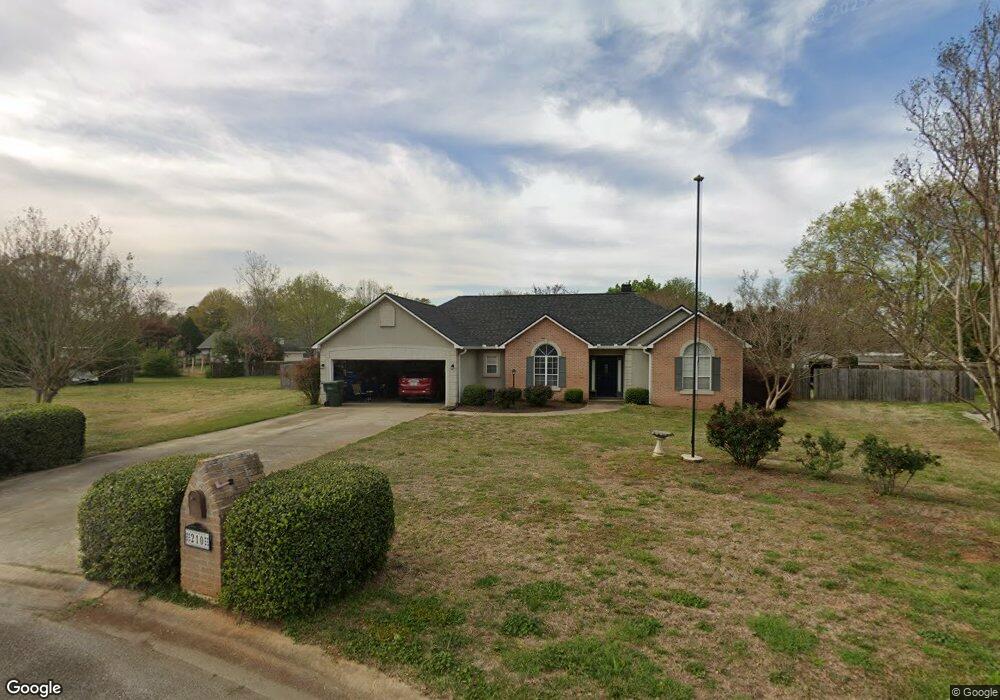
210 Rhett Ct Warner Robins, GA 31088
Estimated Value: $280,000 - $311,000
--
Bed
--
Bath
2,000
Sq Ft
$149/Sq Ft
Est. Value
About This Home
This home is located at 210 Rhett Ct, Warner Robins, GA 31088 and is currently estimated at $297,542, approximately $148 per square foot. 210 Rhett Ct is a home located in Houston County with nearby schools including David A. Perdue Primary School, David A. Perdue Elementary School, and Feagin Mill Middle School.
Ownership History
Date
Name
Owned For
Owner Type
Purchase Details
Closed on
Jan 31, 2020
Sold by
Rackley Michael A
Bought by
Rackley Michael A and Rackley Elizabeth Kay
Current Estimated Value
Home Financials for this Owner
Home Financials are based on the most recent Mortgage that was taken out on this home.
Original Mortgage
$168,500
Outstanding Balance
$149,195
Interest Rate
3.6%
Mortgage Type
New Conventional
Estimated Equity
$148,347
Purchase Details
Closed on
Jul 31, 2006
Sold by
Cook Roy R and Cook Nancy L
Bought by
Rackley Michael A
Home Financials for this Owner
Home Financials are based on the most recent Mortgage that was taken out on this home.
Original Mortgage
$193,171
Interest Rate
6.68%
Mortgage Type
VA
Purchase Details
Closed on
Sep 25, 2000
Sold by
Cook Roy R
Bought by
Cook Roy R and Nancy L*
Purchase Details
Closed on
Sep 28, 1995
Sold by
Thompson Ronald E
Bought by
Mcreynolds Robert L and Theresa E*
Purchase Details
Closed on
Apr 19, 1994
Bought by
Thompson Ronald E
Create a Home Valuation Report for This Property
The Home Valuation Report is an in-depth analysis detailing your home's value as well as a comparison with similar homes in the area
Home Values in the Area
Average Home Value in this Area
Purchase History
| Date | Buyer | Sale Price | Title Company |
|---|---|---|---|
| Rackley Michael A | -- | Amrock | |
| Rackley Michael A | $187,000 | None Available | |
| Cook Roy R | -- | -- | |
| Cook Roy R | $128,000 | -- | |
| Mcreynolds Robert L | $123,000 | -- | |
| Thompson Ronald E | $14,500 | -- |
Source: Public Records
Mortgage History
| Date | Status | Borrower | Loan Amount |
|---|---|---|---|
| Open | Rackley Michael A | $168,500 | |
| Closed | Rackley Michael A | $193,171 |
Source: Public Records
Tax History Compared to Growth
Tax History
| Year | Tax Paid | Tax Assessment Tax Assessment Total Assessment is a certain percentage of the fair market value that is determined by local assessors to be the total taxable value of land and additions on the property. | Land | Improvement |
|---|---|---|---|---|
| 2024 | $2,305 | $98,360 | $14,000 | $84,360 |
| 2023 | $2,100 | $88,880 | $14,000 | $74,880 |
| 2022 | $1,813 | $77,000 | $12,000 | $65,000 |
| 2021 | $1,703 | $72,080 | $12,000 | $60,080 |
| 2020 | $1,545 | $65,280 | $12,000 | $53,280 |
| 2019 | $1,545 | $65,280 | $12,000 | $53,280 |
| 2018 | $1,545 | $65,280 | $12,000 | $53,280 |
| 2017 | $1,546 | $65,280 | $12,000 | $53,280 |
| 2016 | $1,548 | $65,280 | $12,000 | $53,280 |
| 2015 | $1,552 | $65,280 | $12,000 | $53,280 |
| 2014 | -- | $65,280 | $12,000 | $53,280 |
| 2013 | -- | $65,280 | $12,000 | $53,280 |
Source: Public Records
Map
Nearby Homes
- 211 Rhett Ct
- 208 Rhett Ct
- 104 Wilkes Ct
- 102 Wilkes Ct
- 214 Twelve Oaks Dr
- 212 Twelve Oaks Dr
- 106 Wilkes Ct
- 206 Rhett Ct
- 216 Twelve Oaks Dr
- 210 Twelve Oaks Dr
- 207 Rhett Ct
- 209 Rhett Ct
- 205 Rhett Ct
- 0 Rhett Ct Unit 8824970
- 0 Rhett Ct Unit 7188397
- 108 Wilkes Ct
- 208 Twelve Oaks Dr
- 0 Wilkes Ct Unit 8356007
- 204 Rhett Ct
- 103 Wilkes Ct