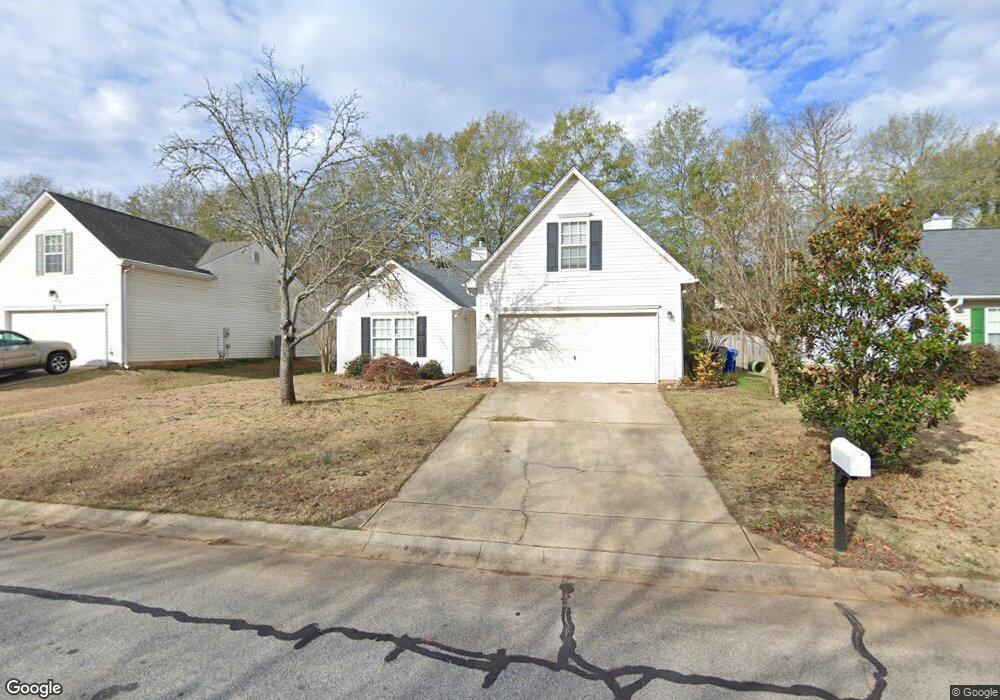
210 Rivereen Way Simpsonville, SC 29680
Estimated Value: $263,604 - $282,000
3
Beds
2
Baths
1,555
Sq Ft
$176/Sq Ft
Est. Value
About This Home
This home is located at 210 Rivereen Way, Simpsonville, SC 29680 and is currently estimated at $274,401, approximately $176 per square foot. 210 Rivereen Way is a home located in Greenville County with nearby schools including Ellen Woodside Elementary School, Ralph Chandler Middle, and Woodmont High School.
Ownership History
Date
Name
Owned For
Owner Type
Purchase Details
Closed on
May 21, 2014
Sold by
Hutchison Andrew A
Bought by
Phillips April and Phillips Taylor
Current Estimated Value
Home Financials for this Owner
Home Financials are based on the most recent Mortgage that was taken out on this home.
Original Mortgage
$127,551
Outstanding Balance
$96,035
Interest Rate
4.32%
Mortgage Type
New Conventional
Estimated Equity
$178,366
Purchase Details
Closed on
Jul 31, 2008
Sold by
Tracy Jonathan D and Tracy Kelly N
Bought by
Hutchison Andrew A
Home Financials for this Owner
Home Financials are based on the most recent Mortgage that was taken out on this home.
Original Mortgage
$124,063
Interest Rate
6.37%
Mortgage Type
Purchase Money Mortgage
Purchase Details
Closed on
Apr 2, 2002
Sold by
Clemons Sondra Genene Weatherford
Bought by
Tracy Jonathan D
Purchase Details
Closed on
Oct 26, 1998
Sold by
The Ryland Group Inc
Bought by
Clemons Steven L
Create a Home Valuation Report for This Property
The Home Valuation Report is an in-depth analysis detailing your home's value as well as a comparison with similar homes in the area
Home Values in the Area
Average Home Value in this Area
Purchase History
| Date | Buyer | Sale Price | Title Company |
|---|---|---|---|
| Phillips April | $125,000 | -- | |
| Hutchison Andrew A | $127,900 | -- | |
| Tracy Jonathan D | $106,900 | -- | |
| Clemons Steven L | $102,609 | -- |
Source: Public Records
Mortgage History
| Date | Status | Borrower | Loan Amount |
|---|---|---|---|
| Open | Phillips April | $127,551 | |
| Previous Owner | Hutchison Andrew A | $124,063 |
Source: Public Records
Tax History
| Year | Tax Paid | Tax Assessment Tax Assessment Total Assessment is a certain percentage of the fair market value that is determined by local assessors to be the total taxable value of land and additions on the property. | Land | Improvement |
|---|---|---|---|---|
| 2025 | $932 | $6,240 | $1,840 | $4,400 |
| 2024 | $932 | $5,430 | $920 | $4,510 |
| 2023 | $905 | $5,430 | $920 | $4,510 |
| 2022 | $883 | $5,430 | $920 | $4,510 |
| 2021 | $868 | $5,430 | $920 | $4,510 |
| 2020 | $811 | $4,720 | $800 | $3,920 |
| 2019 | $788 | $4,720 | $800 | $3,920 |
| 2018 | $859 | $4,720 | $800 | $3,920 |
| 2017 | $860 | $4,720 | $800 | $3,920 |
| 2016 | $824 | $118,020 | $20,000 | $98,020 |
| 2015 | $819 | $118,020 | $20,000 | $98,020 |
| 2014 | $820 | $119,320 | $20,000 | $99,320 |
Source: Public Records
Map
Nearby Homes
- 4 Headwater Ct
- 3 Rivereen Way
- 38 Leafmore Ct
- 14 Leafmore Ct
- 2 Winding Rock Rd
- 234 Deerview Trail
- 620 Columbus Cir
- 601 Columbus Cir
- 218 Deerview Trail
- 1 Catbriar Ct
- 652 Columbus Cir
- 540 Bartoli Ct
- 617 Columbus Cir
- 201 Deerview Trail
- 207 Austin Brook St
- 109 Malibu Ln
- 346 Laguna Ln
- 340 Arnold Mill Rd
- 200 Ellis Mill St
- 503 Plamondon Dr
Your Personal Tour Guide
Ask me questions while you tour the home.