Estimated Value: $170,243 - $211,000
4
Beds
3
Baths
3,032
Sq Ft
$64/Sq Ft
Est. Value
About This Home
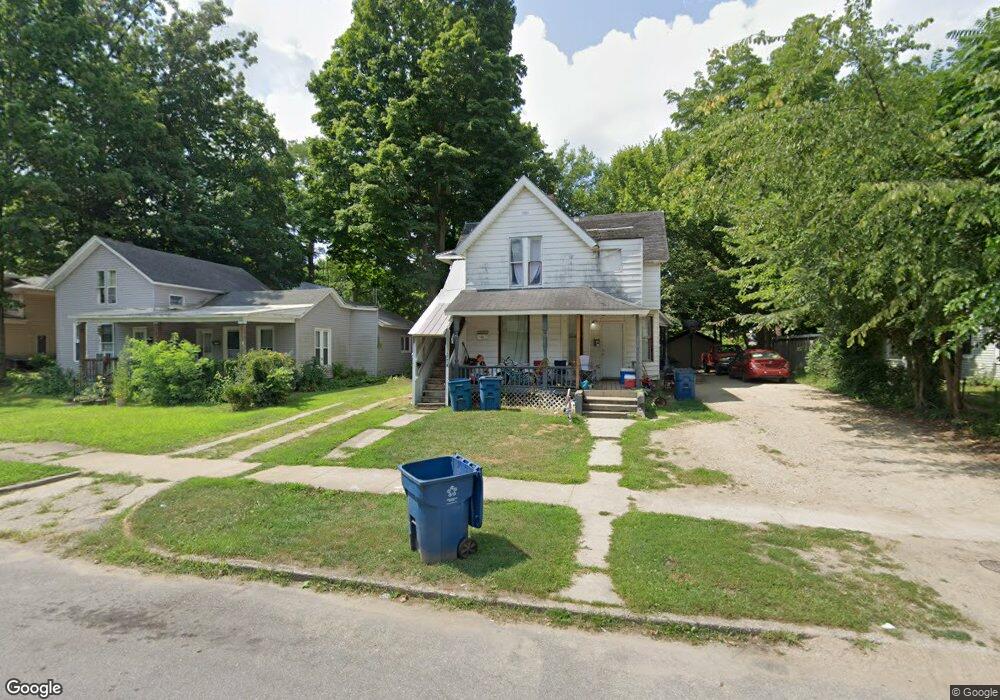
This home is located at 210 S 4th St, Niles, MI 49120 and is currently estimated at $193,311, approximately $63 per square foot. 210 S 4th St is a home located in Berrien County with nearby schools including Ballard Elementary School, Oak Manor Sixth Grade Center, and Ring Lardner Middle School.
Ownership History
Date
Name
Owned For
Owner Type
Purchase Details
Closed on
Oct 3, 2025
Sold by
Rogers Ronnie R
Bought by
On Point Investments Llc
Current Estimated Value
Home Financials for this Owner
Home Financials are based on the most recent Mortgage that was taken out on this home.
Original Mortgage
$503,879
Outstanding Balance
$503,879
Interest Rate
6.58%
Mortgage Type
New Conventional
Estimated Equity
-$310,568
Purchase Details
Closed on
Apr 16, 1999
Purchase Details
Closed on
Jun 30, 1988
Purchase Details
Closed on
Dec 18, 1986
Purchase Details
Closed on
Jun 8, 1979
Purchase Details
Closed on
Apr 25, 1978
Create a Home Valuation Report for This Property
The Home Valuation Report is an in-depth analysis detailing your home's value as well as a comparison with similar homes in the area
Home Values in the Area
Average Home Value in this Area
Purchase History
| Date | Buyer | Sale Price | Title Company |
|---|---|---|---|
| On Point Investments Llc | $495,000 | Chicago Title Of Michigan | |
| -- | $60,000 | -- | |
| -- | $40,000 | -- | |
| -- | $35,000 | -- | |
| -- | $33,500 | -- | |
| -- | $25,000 | -- |
Source: Public Records
Mortgage History
| Date | Status | Borrower | Loan Amount |
|---|---|---|---|
| Open | On Point Investments Llc | $503,879 |
Source: Public Records
Tax History Compared to Growth
Tax History
| Year | Tax Paid | Tax Assessment Tax Assessment Total Assessment is a certain percentage of the fair market value that is determined by local assessors to be the total taxable value of land and additions on the property. | Land | Improvement |
|---|---|---|---|---|
| 2025 | $2,516 | $114,700 | $0 | $0 |
| 2024 | $1,273 | $106,400 | $0 | $0 |
| 2023 | $1,221 | $72,500 | $0 | $0 |
| 2022 | $1,163 | $67,800 | $0 | $0 |
| 2021 | $2,392 | $63,200 | $4,100 | $59,100 |
| 2020 | $2,143 | $48,800 | $0 | $0 |
| 2019 | $2,113 | $48,300 | $11,200 | $37,100 |
| 2018 | $2,038 | $48,300 | $0 | $0 |
| 2017 | $2,016 | $42,300 | $0 | $0 |
| 2016 | $1,982 | $39,600 | $0 | $0 |
| 2015 | $1,976 | $36,400 | $0 | $0 |
| 2014 | $1,009 | $36,300 | $0 | $0 |
Source: Public Records
Map
Nearby Homes
- 211 S 4th St
- 319 S 5th St
- 712 Maple St
- VL Huron St
- 211 S Street Joseph Ave
- 413 S Street Joseph Ave
- 709 Regent St
- 921 Cedar St
- 211 N 8th St
- 124 S State St
- 314 N 6th St
- 923 Regent St
- 1121 Broadway St
- 810 Ferry St
- 321 S 13th St
- Integrity 1610 Plan at Carefree Villas
- Integrity 1605 Plan at Carefree Villas
- Integrity 1250 Plan at Carefree Villas
- Integrity 1530 Plan at Carefree Villas
- 300 Carefree Ct