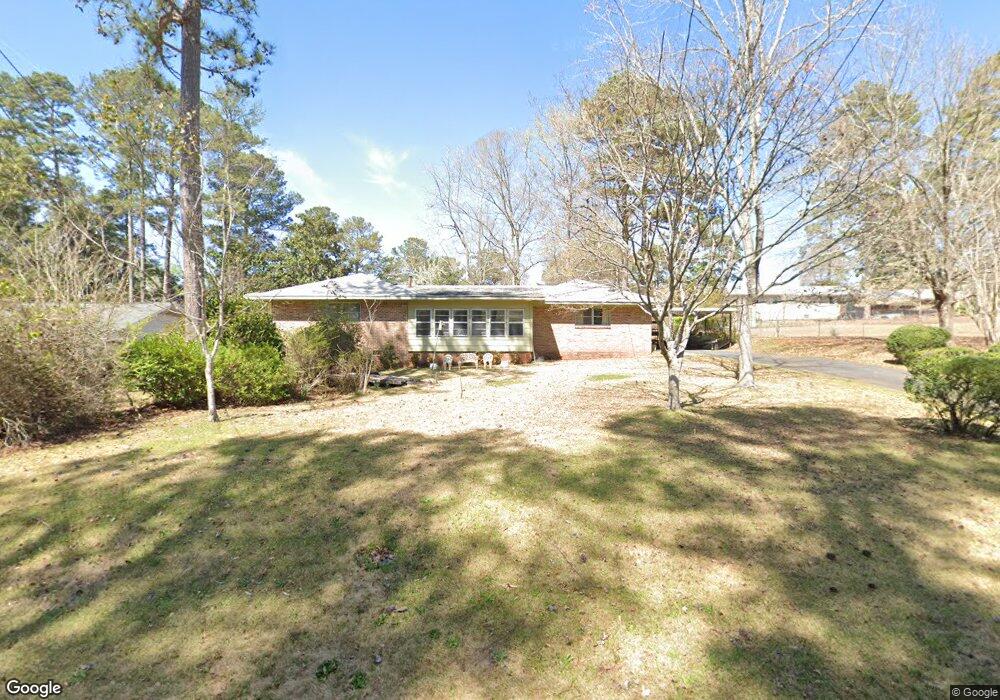
210 S Chilton Crescent Lagrange, GA 30240
Estimated Value: $229,000 - $296,000
3
Beds
2
Baths
2,431
Sq Ft
$105/Sq Ft
Est. Value
About This Home
This home is located at 210 S Chilton Crescent, Lagrange, GA 30240 and is currently estimated at $255,755, approximately $105 per square foot. 210 S Chilton Crescent is a home located in Troup County with nearby schools including Franklin Forest Elementary School, Hollis Hand Elementary School, and Ethel W. Kight Elementary School.
Ownership History
Date
Name
Owned For
Owner Type
Purchase Details
Closed on
Oct 11, 2017
Sold by
Hardy Ilene Bowen
Bought by
Kight Vanda
Current Estimated Value
Purchase Details
Closed on
Nov 9, 2004
Sold by
Hardy James Ray
Bought by
Hardy Ilene Bowen Nka Dobbs
Purchase Details
Closed on
Jun 13, 1967
Sold by
Fuller Warren E
Bought by
Hardy James Ray
Create a Home Valuation Report for This Property
The Home Valuation Report is an in-depth analysis detailing your home's value as well as a comparison with similar homes in the area
Home Values in the Area
Average Home Value in this Area
Purchase History
| Date | Buyer | Sale Price | Title Company |
|---|---|---|---|
| Kight Vanda | -- | -- | |
| Hardy Ilene Bowen Nka Dobbs | -- | -- | |
| Dobbs Ilene Bowen | -- | -- | |
| Hardy James Ray | -- | -- |
Source: Public Records
Tax History Compared to Growth
Tax History
| Year | Tax Paid | Tax Assessment Tax Assessment Total Assessment is a certain percentage of the fair market value that is determined by local assessors to be the total taxable value of land and additions on the property. | Land | Improvement |
|---|---|---|---|---|
| 2024 | $1,998 | $75,232 | $6,440 | $68,792 |
| 2023 | $997 | $88 | $0 | $88 |
| 2022 | $1,445 | $53,780 | $6,440 | $47,340 |
| 2021 | $1,233 | $42,868 | $6,440 | $36,428 |
| 2020 | $1,233 | $42,868 | $6,440 | $36,428 |
| 2019 | $1,150 | $40,120 | $6,440 | $33,680 |
| 2018 | $1,104 | $38,580 | $6,300 | $32,280 |
| 2017 | $1,104 | $38,580 | $6,300 | $32,280 |
| 2016 | $1,073 | $37,562 | $6,300 | $31,262 |
| 2015 | $1,078 | $37,713 | $6,451 | $31,262 |
| 2014 | $1,028 | $36,068 | $6,451 | $29,616 |
| 2013 | -- | $38,700 | $6,488 | $32,212 |
Source: Public Records
Map
Nearby Homes
- 203 S Chilton Crescent
- 201 S Chilton Crescent
- 106 S Chilton Crescent
- 100 Creekside Dr Unit LOT 60A
- 724 Camellia Dr
- 107 Dixie Creek Dr
- 106 Ewing St
- 102 Ewing St
- 748 Lakewood Dr
- 145 Turner St
- 204 Colonial St
- 110 Russell St
- 900 North St
- 806 New Franklin Rd
- 114 Briarcliff Rd
- 109 Thomas St
- 127 Ashling Dr
- 219 Banks St
- 705 Piney Woods Dr
- 134 S Page St
- 212 S Chilton Crescent Unit 30/1/2OF31
- 212 S Chilton Crescent
- 204 S Chilton Crescent
- 204 S Chitlon Crescent
- 207 N Chilton Crescent
- 214 S Chilton Crescent
- 205 N Chilton Crescent
- 205 S Chilton Crescent
- 211 N Chilton Crescent
- 211 S Chilton Crescent
- 211 S Chilton Crescent Unit 6
- 213 N Chilton Crescent
- 0 Chilton Crescent Unit 7309955
- 216 S Chilton Crescent
- 201 N Chilton Crescent
- 138 S Chilton Crescent
- 200 Warwick Rd
- 210 Chesterfield Place
- 0 Chesterfield Place Unit 7495171
- 0 Chesterfield Place Unit 7408603