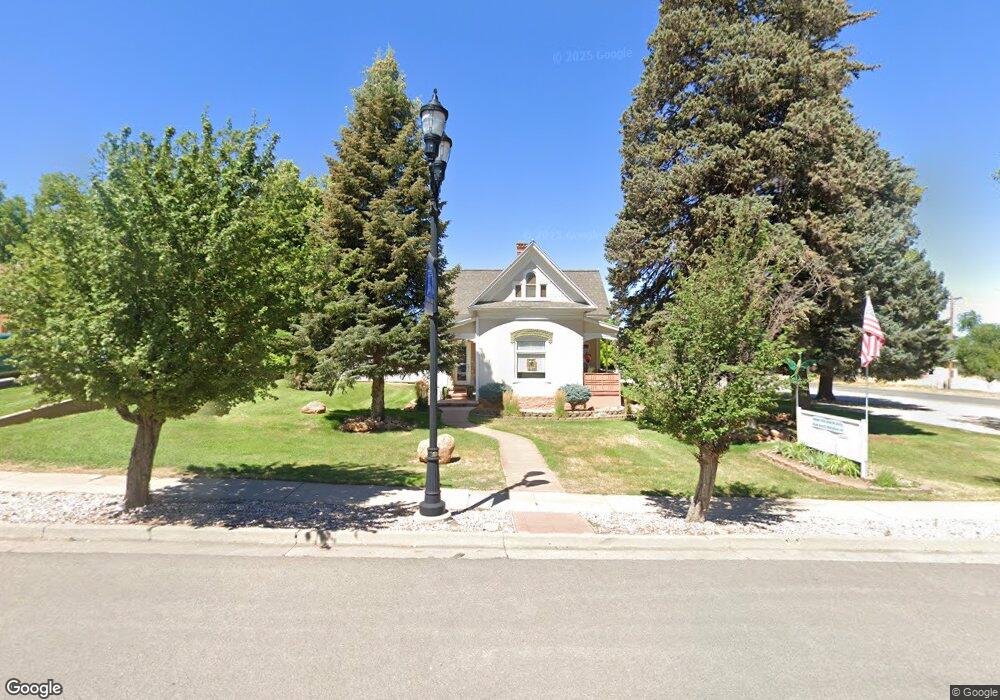
210 S Main St Fillmore, UT 84631
Estimated Value: $343,227 - $354,000
4
Beds
2
Baths
2,456
Sq Ft
$142/Sq Ft
Est. Value
About This Home
This home is located at 210 S Main St, Fillmore, UT 84631 and is currently estimated at $348,557, approximately $141 per square foot. 210 S Main St is a home located in Millard County.
Ownership History
Date
Name
Owned For
Owner Type
Purchase Details
Closed on
Oct 28, 2010
Sold by
Peterson Brent F and Peterson Loretta S
Bought by
Gill Shauna V and Gill William Daniel
Current Estimated Value
Home Financials for this Owner
Home Financials are based on the most recent Mortgage that was taken out on this home.
Original Mortgage
$92,000
Interest Rate
4.27%
Purchase Details
Closed on
Nov 3, 2009
Sold by
Peterson Brent F and Peterson Loretta S
Bought by
Porter Rockwell Executive Suites Llc
Create a Home Valuation Report for This Property
The Home Valuation Report is an in-depth analysis detailing your home's value as well as a comparison with similar homes in the area
Home Values in the Area
Average Home Value in this Area
Purchase History
| Date | Buyer | Sale Price | Title Company |
|---|---|---|---|
| Gill Shauna V | -- | -- | |
| Peterson Brent F | -- | -- | |
| Porter Rockwell Executive Suites Llc | -- | -- |
Source: Public Records
Mortgage History
| Date | Status | Borrower | Loan Amount |
|---|---|---|---|
| Closed | Peterson Brent F | $92,000 |
Source: Public Records
Tax History Compared to Growth
Tax History
| Year | Tax Paid | Tax Assessment Tax Assessment Total Assessment is a certain percentage of the fair market value that is determined by local assessors to be the total taxable value of land and additions on the property. | Land | Improvement |
|---|---|---|---|---|
| 2025 | $1,574 | $197,641 | $25,618 | $172,023 |
| 2024 | $1,574 | $151,787 | $20,292 | $131,495 |
| 2023 | $1,638 | $151,787 | $20,292 | $131,495 |
| 2022 | $1,586 | $142,366 | $18,448 | $123,918 |
| 2021 | $1,405 | $121,145 | $11,979 | $109,166 |
| 2020 | $1,303 | $112,976 | $10,890 | $102,086 |
| 2019 | $1,025 | $89,184 | $10,890 | $78,294 |
| 2018 | $977 | $86,976 | $10,890 | $76,086 |
| 2017 | $889 | $75,207 | $10,890 | $64,317 |
| 2016 | $850 | $75,207 | $10,890 | $64,317 |
| 2015 | $850 | $75,207 | $10,890 | $64,317 |
| 2014 | -- | $75,207 | $10,890 | $64,317 |
| 2013 | -- | $75,207 | $10,890 | $64,317 |
Source: Public Records
Map
Nearby Homes
- 220 S 200 E
- 190 W 400 St S
- 40 S 100 Rd E
- 155 E 500 St S
- 157 E 500 South St
- 75 N 100 West St
- 405 E 500 St S
- 165 N 100 W
- 430 E Canyon Rd
- 225 W 200 St N
- 310 S 500 West Rd
- 310 S 600 E
- 295 N 100 West St
- 760 E 700 St S
- 390 N 100 W
- 380 N 200 St W
- 690 E 500 S
- 335 W 400 North St
- 750 800 South Fillmore
- 825 800 South Fillmore