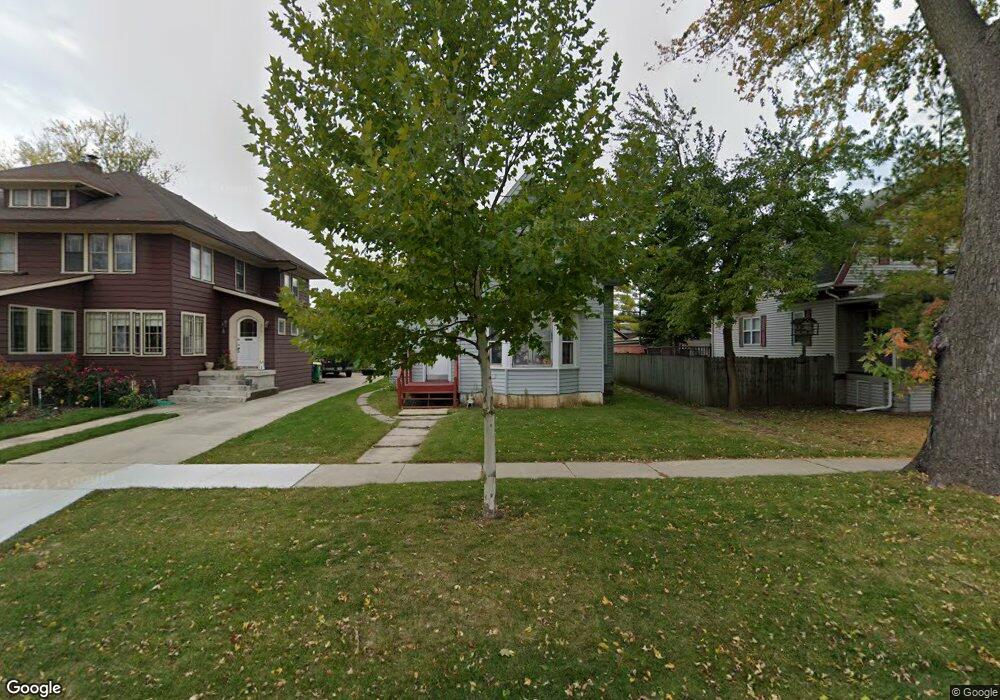
210 S Maple Ave Green Bay, WI 54303
Seymour Park NeighborhoodEstimated Value: $249,000 - $280,000
6
Beds
3
Baths
2,464
Sq Ft
$109/Sq Ft
Est. Value
About This Home
This home is located at 210 S Maple Ave, Green Bay, WI 54303 and is currently estimated at $269,333, approximately $109 per square foot. 210 S Maple Ave is a home located in Brown County with nearby schools including Fort Howard Elementary School, Franklin Middle School, and West High School.
Ownership History
Date
Name
Owned For
Owner Type
Purchase Details
Closed on
Apr 23, 2025
Sold by
Norton James A and Norton Julia G
Bought by
Norton Nicole B and Norton Y
Current Estimated Value
Purchase Details
Closed on
Sep 19, 2005
Sold by
Norton James A
Bought by
Norton James A and Norton Julia G
Home Financials for this Owner
Home Financials are based on the most recent Mortgage that was taken out on this home.
Original Mortgage
$69,300
Interest Rate
6.62%
Mortgage Type
Fannie Mae Freddie Mac
Purchase Details
Closed on
Sep 1, 2002
Sold by
Sandgren Gilbert R and Stanlaw Karen A
Bought by
Norton James A
Home Financials for this Owner
Home Financials are based on the most recent Mortgage that was taken out on this home.
Original Mortgage
$40,922
Interest Rate
8%
Mortgage Type
Seller Take Back
Purchase Details
Closed on
Aug 3, 1998
Sold by
Sandgren Gilbert R and Savage George F
Bought by
Norton James A
Home Financials for this Owner
Home Financials are based on the most recent Mortgage that was taken out on this home.
Original Mortgage
$42,877
Interest Rate
8.5%
Create a Home Valuation Report for This Property
The Home Valuation Report is an in-depth analysis detailing your home's value as well as a comparison with similar homes in the area
Home Values in the Area
Average Home Value in this Area
Purchase History
| Date | Buyer | Sale Price | Title Company |
|---|---|---|---|
| Norton Nicole B | -- | -- | |
| Norton James A | -- | Evans Title | |
| Norton James A | -- | Evans Title | |
| Norton James A | $40,922 | -- | |
| Norton James A | $42,877 | -- |
Source: Public Records
Mortgage History
| Date | Status | Borrower | Loan Amount |
|---|---|---|---|
| Previous Owner | Norton James A | $69,300 | |
| Previous Owner | Norton James A | $40,922 | |
| Previous Owner | Norton James A | $42,877 |
Source: Public Records
Tax History Compared to Growth
Tax History
| Year | Tax Paid | Tax Assessment Tax Assessment Total Assessment is a certain percentage of the fair market value that is determined by local assessors to be the total taxable value of land and additions on the property. | Land | Improvement |
|---|---|---|---|---|
| 2024 | $2,565 | $130,500 | $12,400 | $118,100 |
| 2023 | $2,449 | $130,500 | $12,400 | $118,100 |
| 2022 | $2,370 | $130,500 | $12,400 | $118,100 |
| 2021 | $2,140 | $83,600 | $9,800 | $73,800 |
| 2020 | $1,989 | $83,600 | $9,800 | $73,800 |
| 2019 | $2,258 | $83,600 | $9,800 | $73,800 |
| 2018 | $1,885 | $83,600 | $9,800 | $73,800 |
| 2017 | $1,836 | $83,600 | $9,800 | $73,800 |
| 2016 | $3,687 | $83,600 | $9,800 | $73,800 |
| 2015 | $2,699 | $83,600 | $9,800 | $73,800 |
| 2014 | $1,974 | $83,600 | $9,800 | $73,800 |
| 2013 | $1,974 | $83,600 | $9,800 | $73,800 |
Source: Public Records
Map
Nearby Homes
- 222 S Chestnut Ave
- 613 W Walnut St
- 117 S Oakland Ave
- 817 Cora St
- 124 Antoinette St
- 605 S Greenwood Ave
- 890 Shawano Ave
- 0 Water Mint Ct Unit 50310354
- 0 Water Mint Ct Unit 50309572
- 0 Water Mint Ct Unit 50310284
- 0 Water Mint Ct Unit 50310190
- 0 Water Mint Ct Unit 50310285
- 0 Water Mint Ct Unit 50310288
- 0 Water Mint Ct Unit 50310181
- 0 Water Mint Ct Unit 50309574
- 0 Water Mint Ct Unit 50309381
- 0 Water Mint Ct Unit 50309172
- 0 Water Mint Ct Unit 50310189
- 0 Water Mint Ct Unit 50310286
- 0 Water Mint Ct Unit 50309573
- 216 S Maple Ave
- 208 S Maple Ave
- 204 S Maple Ave
- 200 S Maple Ave
- 220 S Maple Ave
- 217 S Ashland Ave
- 219 S Ashland Ave
- 213 S Ashland Ave
- 609 Howard St
- 221 S Ashland Ave
- 207 S Ashland Ave
- 230 S Maple Ave
- 217 S Maple Ave
- 221 S Maple Ave
- 225 S Ashland Ave
- 611 Howard St
- 209 S Maple Ave
- 225 S Maple Ave Unit 227
- 235 S Ashland Ave
- 207 S Maple Ave