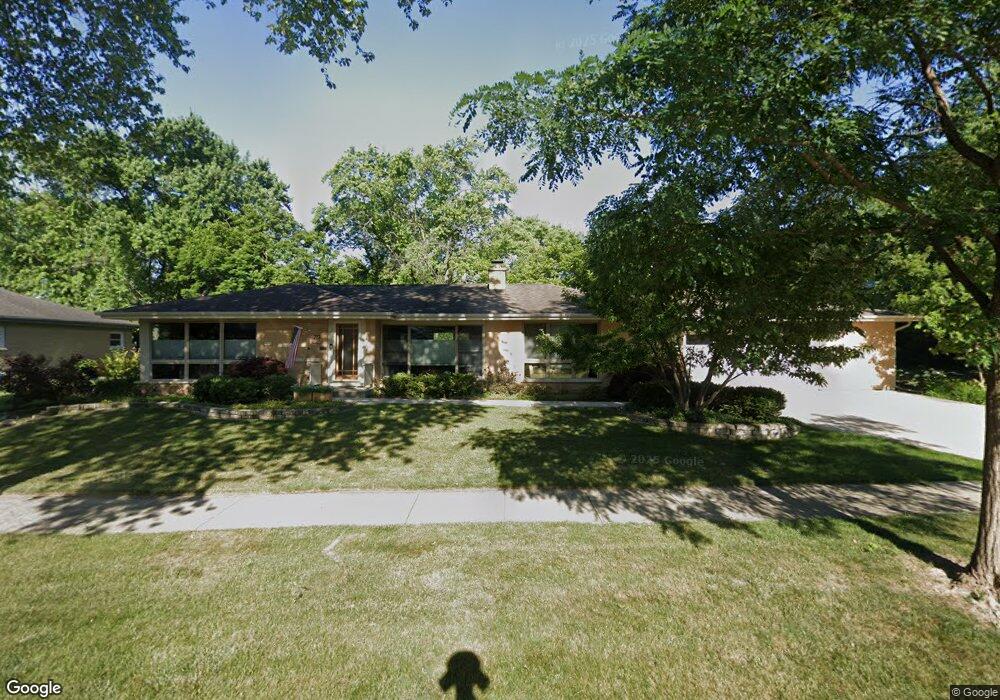
210 S Princeton Ave Unit C Arlington Heights, IL 60005
Westgate NeighborhoodEstimated Value: $452,000 - $557,000
4
Beds
2
Baths
1,495
Sq Ft
$349/Sq Ft
Est. Value
About This Home
This home is located at 210 S Princeton Ave Unit C, Arlington Heights, IL 60005 and is currently estimated at $522,361, approximately $349 per square foot. 210 S Princeton Ave Unit C is a home located in Cook County with nearby schools including Westgate Elementary School, South Middle School, and Rolling Meadows High School.
Ownership History
Date
Name
Owned For
Owner Type
Purchase Details
Closed on
May 2, 2018
Sold by
Johnston Ann and Cimarusti George
Bought by
Cimarusti George and George Cimarusti Declaration Of Trust
Current Estimated Value
Purchase Details
Closed on
Mar 19, 1998
Sold by
Calderwood William L
Bought by
Cimarusti George
Home Financials for this Owner
Home Financials are based on the most recent Mortgage that was taken out on this home.
Original Mortgage
$100,000
Outstanding Balance
$18,992
Interest Rate
7.45%
Estimated Equity
$503,369
Create a Home Valuation Report for This Property
The Home Valuation Report is an in-depth analysis detailing your home's value as well as a comparison with similar homes in the area
Home Values in the Area
Average Home Value in this Area
Purchase History
| Date | Buyer | Sale Price | Title Company |
|---|---|---|---|
| Cimarusti George | -- | None Available | |
| Cimarusti George | $183,000 | -- |
Source: Public Records
Mortgage History
| Date | Status | Borrower | Loan Amount |
|---|---|---|---|
| Open | Cimarusti George | $100,000 |
Source: Public Records
Tax History Compared to Growth
Tax History
| Year | Tax Paid | Tax Assessment Tax Assessment Total Assessment is a certain percentage of the fair market value that is determined by local assessors to be the total taxable value of land and additions on the property. | Land | Improvement |
|---|---|---|---|---|
| 2024 | $9,495 | $38,000 | $8,190 | $29,810 |
| 2023 | $9,117 | $38,000 | $8,190 | $29,810 |
| 2022 | $9,117 | $38,000 | $8,190 | $29,810 |
| 2021 | $7,532 | $28,351 | $6,398 | $21,953 |
| 2020 | $7,404 | $28,351 | $6,398 | $21,953 |
| 2019 | $7,380 | $31,537 | $6,398 | $25,139 |
| 2018 | $8,286 | $31,829 | $5,630 | $26,199 |
| 2017 | $8,206 | $31,829 | $5,630 | $26,199 |
| 2016 | $7,889 | $31,829 | $5,630 | $26,199 |
| 2015 | $7,329 | $27,445 | $4,863 | $22,582 |
| 2014 | $7,131 | $27,445 | $4,863 | $22,582 |
| 2013 | $6,934 | $27,445 | $4,863 | $22,582 |
Source: Public Records
Map
Nearby Homes
- 222 S Dwyer Ave
- 12 S Princeton Ct
- 316 S Reuter Dr
- 24 S Kaspar Ave
- 34 N Reuter Dr
- 1419 W Miner St
- 1615 W Johanna Terrace
- 502 S Reuter Dr
- 1418 W Saint James Place
- 2100 Martin Ln
- 2201 Kingfisher Ln
- 2306 Kingfisher Ln
- 3206 Kingfisher Ct
- 105 S Mitchell Ave
- 514 W Miner St Unit 2F
- 2410 Sigwalt St
- 751 S Dwyer Ave Unit F
- 617 N Wilke Rd
- 318 W Wing St
- 314 W Wing St
- 201 S Yale Ave
- 222 S Princeton Ave
- 205 S Yale Ave
- 215 S Princeton Ave
- 211 S Princeton Ave
- 226 S Princeton Ave
- 221 S Princeton Ave
- 211 S Yale Ave
- 200 S Yale Ave
- 225 S Princeton Ave
- 111 S Yale Ave
- 120 S Yale Ave
- 232 S Princeton Ave
- 203 S Princeton Ave
- 202 S Yale Ave
- 231 S Princeton Ave
- 116 S Yale Ave
- 207 S Princeton Ave
- 217 S Yale Ave
- 204 S Yale Ave