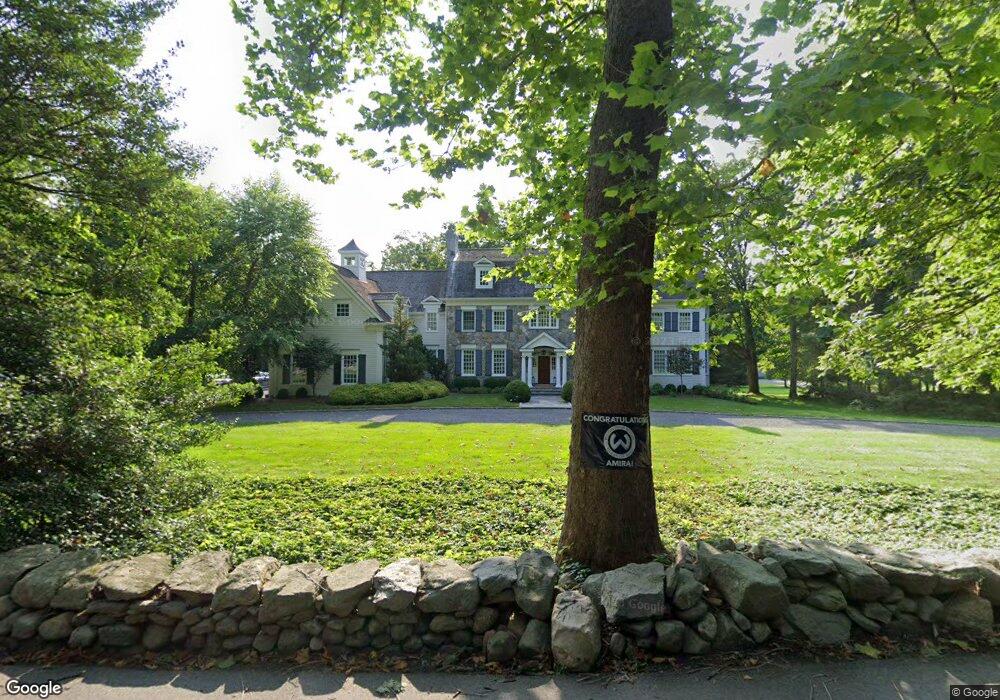
210 Silver Spring Rd Wilton, CT 06897
Estimated Value: $2,083,276 - $4,623,000
6
Beds
7
Baths
9,925
Sq Ft
$364/Sq Ft
Est. Value
About This Home
This home is located at 210 Silver Spring Rd, Wilton, CT 06897 and is currently estimated at $3,616,569, approximately $364 per square foot. 210 Silver Spring Rd is a home located in Fairfield County with nearby schools including Miller-Driscoll School, Cider Mill School, and Middlebrook School.
Ownership History
Date
Name
Owned For
Owner Type
Purchase Details
Closed on
Jan 14, 2011
Sold by
Stonewall Homes Llc
Bought by
Srivastava Sanjeev and Srivastava Lisbet L
Current Estimated Value
Purchase Details
Closed on
Aug 4, 2005
Sold by
Silver Spring Assoc Ll
Bought by
Stonewall Homes Llc
Purchase Details
Closed on
May 8, 2002
Sold by
Silver Daniel I and Silver Iva S
Bought by
Neal John Vincent
Purchase Details
Closed on
Jul 30, 1999
Sold by
Freeman Matthew
Bought by
Silver Daniel and Silver Iva
Purchase Details
Closed on
Dec 17, 1993
Sold by
Freeman Matthew
Bought by
Baxendale Anthony and Baxendale Tracey
Purchase Details
Closed on
Jun 25, 1992
Sold by
Nordquist Robert and Nordquist Barbara
Bought by
Freeman Matthew and Connors Tracey
Purchase Details
Closed on
Oct 27, 1989
Sold by
Johnson Gilbert
Bought by
Nordquist Robert
Create a Home Valuation Report for This Property
The Home Valuation Report is an in-depth analysis detailing your home's value as well as a comparison with similar homes in the area
Home Values in the Area
Average Home Value in this Area
Purchase History
| Date | Buyer | Sale Price | Title Company |
|---|---|---|---|
| Srivastava Sanjeev | $2,530,000 | -- | |
| Stonewall Homes Llc | $900,000 | -- | |
| Neal John Vincent | $520,000 | -- | |
| Silver Daniel | $435,800 | -- | |
| Baxendale Anthony | $415,000 | -- | |
| Freeman Matthew | $415,000 | -- | |
| Nordquist Robert | $350,000 | -- |
Source: Public Records
Mortgage History
| Date | Status | Borrower | Loan Amount |
|---|---|---|---|
| Open | Nordquist Robert | $1,074,193 | |
| Closed | Nordquist Robert | $1,200,000 |
Source: Public Records
Tax History
| Year | Tax Paid | Tax Assessment Tax Assessment Total Assessment is a certain percentage of the fair market value that is determined by local assessors to be the total taxable value of land and additions on the property. | Land | Improvement |
|---|---|---|---|---|
| 2025 | $49,152 | $2,013,620 | $308,490 | $1,705,130 |
| 2024 | $48,206 | $2,013,620 | $308,490 | $1,705,130 |
| 2023 | $56,381 | $1,666,910 | $294,980 | $1,371,930 |
| 2022 | $47,057 | $1,666,910 | $294,980 | $1,371,930 |
| 2021 | $10,915 | $1,666,910 | $294,980 | $1,371,930 |
| 2020 | $45,773 | $1,666,910 | $294,980 | $1,371,930 |
| 2019 | $11,197 | $1,647,100 | $294,980 | $1,352,120 |
| 2018 | $52,190 | $1,851,360 | $310,240 | $1,541,120 |
| 2017 | $51,412 | $1,851,360 | $310,240 | $1,541,120 |
| 2016 | $50,616 | $1,851,360 | $310,240 | $1,541,120 |
| 2015 | $49,672 | $1,851,360 | $310,240 | $1,541,120 |
| 2014 | $49,080 | $1,851,360 | $310,240 | $1,541,120 |
Source: Public Records
Map
Nearby Homes
- 78 Ruscoe Rd
- 10 Silvermine Dr
- 54 Lockwood Rd
- 136 Elmwood Rd
- Lot 4 Lockwood Rd
- 212 Elmwood Rd
- 6 Morganti Ct
- 87 Silver Hill Rd
- 14 Tanners Dr
- 55 Tanners Dr
- 256 Smith Ridge Rd
- 160 Wilton Rd W
- 164 Wilton Rd W
- 7 Douglas Dr
- 51 Deer Run Rd
- 1 Canaan Cir
- Lot 6 Cattle Pen Ln
- 8 West Ln
- 178 Linden Tree Rd
- 156 Stone Meadow Unit 16156
- 216 Silver Spring Rd
- 7 Sugarbush Ct
- 206 Silver Spring Rd
- 222 Silver Spring Rd
- 182 Silver Spring Rd
- 194 Silver Spring Rd
- 195 Silver Spring Rd
- 6 Sugarbush Ct
- 17 Sugarbush Ct
- 232 Silver Spring Rd
- 12 Sugarbush Ct
- 51 Mayflower Dr
- 19 Sugarbush Ct
- 174 Silver Spring Rd
- 61 Mayflower Dr
- 22 Sugarbush Ct
- 202 Silver Spring Rd
- 247 Silver Spring Rd
- 239 Silver Spring Rd
- 179 Silver Spring Rd
Your Personal Tour Guide
Ask me questions while you tour the home.