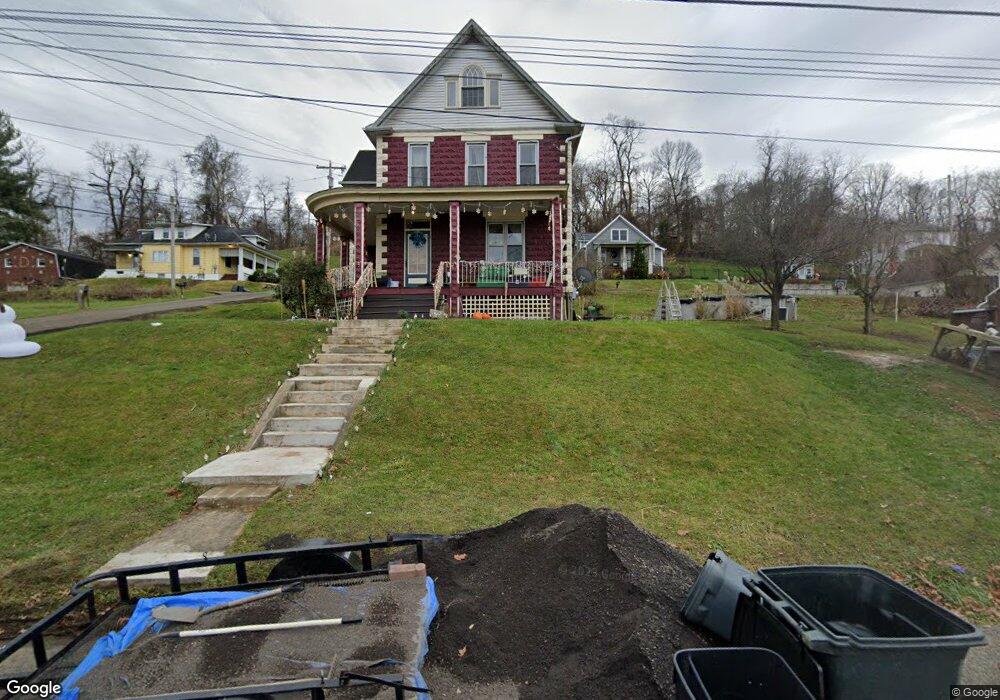
210 South St New Eagle, PA 15067
Estimated Value: $137,000 - $170,000
3
Beds
2
Baths
1,820
Sq Ft
$85/Sq Ft
Est. Value
About This Home
This home is located at 210 South St, New Eagle, PA 15067 and is currently estimated at $154,032, approximately $84 per square foot. 210 South St is a home located in Washington County with nearby schools including Ringgold High School and Madonna Catholic Regional School.
Ownership History
Date
Name
Owned For
Owner Type
Purchase Details
Closed on
Aug 4, 2022
Sold by
Adam Schottenheimer
Bought by
Kray Terry
Current Estimated Value
Home Financials for this Owner
Home Financials are based on the most recent Mortgage that was taken out on this home.
Original Mortgage
$137,082
Outstanding Balance
$130,836
Interest Rate
5.3%
Mortgage Type
Balloon
Estimated Equity
$23,197
Purchase Details
Closed on
Apr 8, 2011
Sold by
Grazulis Joseph
Bought by
Schottenheimer Adam
Home Financials for this Owner
Home Financials are based on the most recent Mortgage that was taken out on this home.
Original Mortgage
$83,937
Interest Rate
4.99%
Mortgage Type
New Conventional
Purchase Details
Closed on
Apr 10, 2003
Sold by
Est Of Helen Smolak
Bought by
Grazulis Joseph
Home Financials for this Owner
Home Financials are based on the most recent Mortgage that was taken out on this home.
Original Mortgage
$38,050
Interest Rate
5.86%
Mortgage Type
New Conventional
Create a Home Valuation Report for This Property
The Home Valuation Report is an in-depth analysis detailing your home's value as well as a comparison with similar homes in the area
Home Values in the Area
Average Home Value in this Area
Purchase History
| Date | Buyer | Sale Price | Title Company |
|---|---|---|---|
| Kray Terry | $134,000 | None Listed On Document | |
| Schottenheimer Adam | $81,000 | -- | |
| Grazulis Joseph | $42,300 | -- |
Source: Public Records
Mortgage History
| Date | Status | Borrower | Loan Amount |
|---|---|---|---|
| Open | Kray Terry | $137,082 | |
| Previous Owner | Schottenheimer Adam | $83,937 | |
| Previous Owner | Grazulis Joseph | $38,050 |
Source: Public Records
Tax History
| Year | Tax Paid | Tax Assessment Tax Assessment Total Assessment is a certain percentage of the fair market value that is determined by local assessors to be the total taxable value of land and additions on the property. | Land | Improvement |
|---|---|---|---|---|
| 2025 | $1,971 | $90,900 | $19,400 | $71,500 |
| 2024 | $1,834 | $90,900 | $19,400 | $71,500 |
| 2023 | $1,834 | $90,900 | $19,400 | $71,500 |
| 2022 | $1,798 | $90,900 | $19,400 | $71,500 |
| 2021 | $1,775 | $90,900 | $19,400 | $71,500 |
| 2020 | $1,739 | $90,900 | $19,400 | $71,500 |
| 2019 | $1,721 | $90,900 | $19,400 | $71,500 |
| 2018 | $1,703 | $90,900 | $19,400 | $71,500 |
| 2017 | $201 | $90,900 | $19,400 | $71,500 |
| 2016 | $201 | $8,060 | $1,119 | $6,941 |
| 2015 | -- | $8,060 | $1,119 | $6,941 |
| 2014 | $201 | $8,060 | $1,119 | $6,941 |
| 2013 | $201 | $8,060 | $1,119 | $6,941 |
Source: Public Records
Map
Nearby Homes
- 180 Morton St
- 123 4th Ave
- 136 Bunola River Rd
- 108 Rush Ave
- 1102 Lawton St
- 105 Eagle Pointe Dr
- 102 10th St
- 1001 W Main St
- 1039 4th St
- 102,104,106,108 9th St
- 804 Railroad St
- 102-104 8th St
- 120 Crestview Manor
- 614 Lincoln St
- 101 7th St
- 424 Hillman St
- 1562 4th St
- 0 Dry Run Rd
- 504 Marne Ave
- 509 W Main St
Your Personal Tour Guide
Ask me questions while you tour the home.