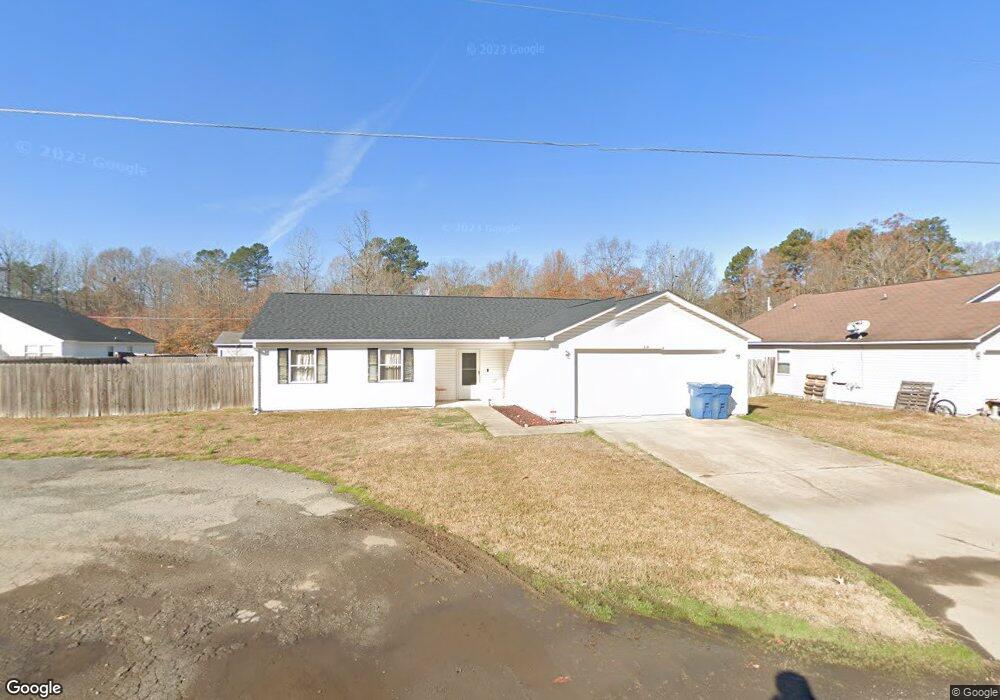
210 Spring Branch Dr Benton, AR 72015
Estimated Value: $174,000 - $197,000
Studio
2
Baths
1,368
Sq Ft
$137/Sq Ft
Est. Value
About This Home
This home is located at 210 Spring Branch Dr, Benton, AR 72015 and is currently estimated at $187,313, approximately $136 per square foot. 210 Spring Branch Dr is a home located in Saline County with nearby schools including Westbrook Elementary School, Harmony Grove Middle School, and Harmony Grove High School.
Ownership History
Date
Name
Owned For
Owner Type
Purchase Details
Closed on
Mar 22, 2018
Sold by
Johnson Patty A and Johnson Richard
Bought by
Thompson Richard P
Current Estimated Value
Purchase Details
Closed on
Aug 11, 2008
Sold by
Harrison Jeffrey T and Harrison Carla R
Bought by
Thompson Patty A and Thompson Richard P
Home Financials for this Owner
Home Financials are based on the most recent Mortgage that was taken out on this home.
Original Mortgage
$100,916
Outstanding Balance
$66,396
Interest Rate
6.38%
Mortgage Type
FHA
Estimated Equity
$120,917
Purchase Details
Closed on
Apr 29, 2008
Sold by
Springbranch Llc
Bought by
Harrison Jeffrey T and Harrison Carla R
Home Financials for this Owner
Home Financials are based on the most recent Mortgage that was taken out on this home.
Original Mortgage
$80,000
Interest Rate
5.84%
Mortgage Type
New Conventional
Create a Home Valuation Report for This Property
The Home Valuation Report is an in-depth analysis detailing your home's value as well as a comparison with similar homes in the area
Home Values in the Area
Average Home Value in this Area
Purchase History
| Date | Buyer | Sale Price | Title Company |
|---|---|---|---|
| Thompson Richard P | -- | None Available | |
| Thompson Patty A | $103,000 | None Available | |
| Harrison Jeffrey T | $100,000 | None Available |
Source: Public Records
Mortgage History
| Date | Status | Borrower | Loan Amount |
|---|---|---|---|
| Open | Thompson Patty A | $100,916 | |
| Previous Owner | Harrison Jeffrey T | $80,000 |
Source: Public Records
Tax History
| Year | Tax Paid | Tax Assessment Tax Assessment Total Assessment is a certain percentage of the fair market value that is determined by local assessors to be the total taxable value of land and additions on the property. | Land | Improvement |
|---|---|---|---|---|
| 2025 | $1,526 | $27,104 | $4,200 | $22,904 |
| 2024 | $1,457 | $27,104 | $4,200 | $22,904 |
| 2023 | $1,409 | $27,104 | $4,200 | $22,904 |
| 2022 | $1,292 | $27,104 | $4,200 | $22,904 |
| 2021 | $1,177 | $19,840 | $3,200 | $16,640 |
| 2020 | $1,177 | $19,840 | $3,200 | $16,640 |
| 2019 | $1,121 | $19,840 | $3,200 | $16,640 |
| 2018 | $771 | $19,840 | $3,200 | $16,640 |
| 2017 | $771 | $19,840 | $3,200 | $16,640 |
| 2016 | $1,081 | $19,130 | $3,200 | $15,930 |
| 2015 | $731 | $19,130 | $3,200 | $15,930 |
| 2014 | $731 | $19,130 | $3,200 | $15,930 |
Source: Public Records
Map
Nearby Homes
- 1019 Grand Ave
- 114 Hayes Haskell St
- 370 Meadow Creek Dr
- 1310 Caroline Cove
- 350 Meadow Creek Dr
- 1445 Pine
- 306 Meadow Creek Dr
- 401 Aden Ave
- 112 Kee Cove
- 5060 N Highway 229
- 529 Dodson Creek Rd
- 810 Troutman Rd
- 815 Graham Rd
- 3.25 Hwy 67
- 110 Harmony Village Dr
- 122 Harmony Village Dr
- Lot 91 Harmony Village Dr
- Lot 89 Harmony Village Dr
- 111 Harmony Village Dr
- 119 Harmony Village Dr
- 212 Spring Branch Dr
- 208 Spring Branch Dr
- 209 Rose St
- 211 Rose St
- 0 Rose St
- 207 Rose St
- 209 Spring Branch Dr
- 209 Spring Branch Dr Unit Haskell
- 209 Spring Branch Dr
- 0 Spring Branch Dr Unit 17034149
- 0 Spring Branch Dr Unit 17035027
- 213 Rose St
- 214 Spring Branch Dr
- 211 Spring Branch Dr
- 207 Spring Branch Dr
- 206 Spring Branch Dr
- 000 Rose St
- 205 Rose St
- 213 Spring Branch Dr
- 205 Spring Branch Dr
Your Personal Tour Guide
Ask me questions while you tour the home.