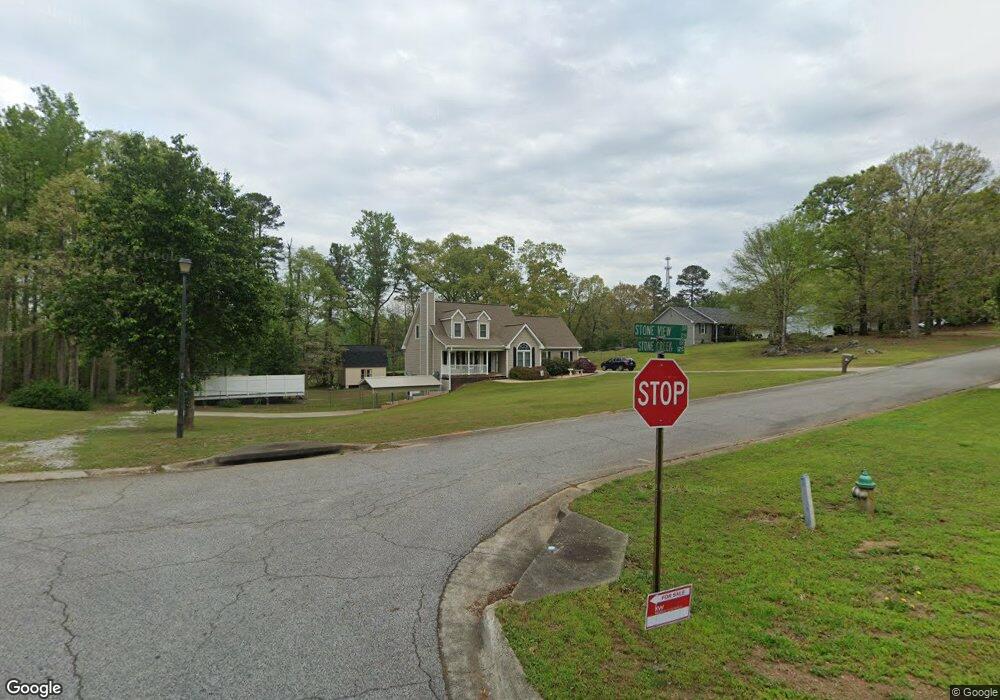
210 Stone View Dr Hoschton, GA 30548
Estimated Value: $416,000 - $456,909
--
Bed
2
Baths
2,217
Sq Ft
$197/Sq Ft
Est. Value
About This Home
This home is located at 210 Stone View Dr, Hoschton, GA 30548 and is currently estimated at $436,477, approximately $196 per square foot. 210 Stone View Dr is a home located in Jackson County with nearby schools including Gum Springs Elementary School, West Jackson Middle School, and Jackson County High School.
Ownership History
Date
Name
Owned For
Owner Type
Purchase Details
Closed on
Oct 18, 2021
Sold by
Davis Rex A
Bought by
Baillargeon Guy and Baillargeon Denise
Current Estimated Value
Purchase Details
Closed on
Feb 26, 2021
Sold by
Davis Janet F
Bought by
Davis Rex A
Purchase Details
Closed on
Dec 2, 2002
Sold by
Davis Janet F
Bought by
Davis Janet F and Davis Rex
Purchase Details
Closed on
Nov 25, 2002
Sold by
Davis Rex
Bought by
Davis Janet F
Purchase Details
Closed on
Jan 23, 1998
Sold by
Davis Rex
Bought by
Davis Janet F
Purchase Details
Closed on
Sep 8, 1997
Bought by
Davis Janet F
Create a Home Valuation Report for This Property
The Home Valuation Report is an in-depth analysis detailing your home's value as well as a comparison with similar homes in the area
Home Values in the Area
Average Home Value in this Area
Purchase History
| Date | Buyer | Sale Price | Title Company |
|---|---|---|---|
| Baillargeon Guy | $360,000 | -- | |
| Davis Rex A | -- | -- | |
| Davis Janet F | -- | -- | |
| Davis Janet F | -- | -- | |
| Davis Janet F | $1,000 | -- | |
| Davis Janet F | $124,500 | -- |
Source: Public Records
Tax History Compared to Growth
Tax History
| Year | Tax Paid | Tax Assessment Tax Assessment Total Assessment is a certain percentage of the fair market value that is determined by local assessors to be the total taxable value of land and additions on the property. | Land | Improvement |
|---|---|---|---|---|
| 2024 | $3,119 | $128,524 | $24,000 | $104,524 |
| 2023 | $3,119 | $115,932 | $24,000 | $91,932 |
| 2022 | $2,659 | $95,732 | $24,000 | $71,732 |
| 2021 | $2,459 | $89,692 | $17,960 | $71,732 |
| 2020 | $2,198 | $73,332 | $11,840 | $61,492 |
| 2019 | $2,289 | $73,332 | $11,840 | $61,492 |
| 2018 | $2,247 | $70,928 | $11,840 | $59,088 |
| 2017 | $2,135 | $66,764 | $11,840 | $54,924 |
| 2016 | $2,147 | $66,764 | $11,840 | $54,924 |
| 2015 | $1,889 | $58,460 | $6,000 | $52,460 |
| 2014 | $1,403 | $43,083 | $6,000 | $37,083 |
| 2013 | -- | $39,745 | $6,000 | $33,745 |
Source: Public Records
Map
Nearby Homes
- 210 Stoneview Dr
- 176 Stone View Dr
- 176 Stone View Dr Unit 26
- 236 Stone View Dr
- 191 Stoneview Dr
- 191 Stone View Dr
- 144 Stone View Dr
- 245 Stone View Dr
- 143 Stoneview Dr
- 245 Stoneview Dr
- 272 Stone View Dr
- 143 Stone View Dr
- 124 Stone View Dr
- 136 Stone Creek Dr
- 298 Stoneview Dr
- 51 Plum Ct
- 267 Stone View Dr
- 100 Stoneview Dr
- 100 Stone View Dr
- 298 Stone View Dr