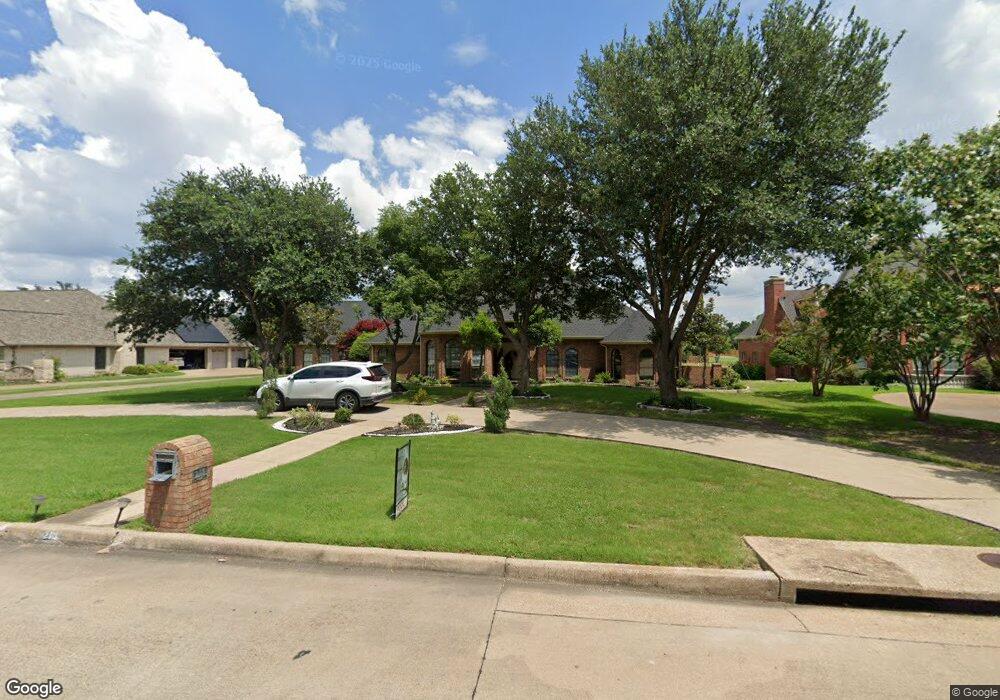
210 Sunray Ln Sunnyvale, TX 75182
Estimated Value: $772,545 - $797,000
4
Beds
4
Baths
3,295
Sq Ft
$239/Sq Ft
Est. Value
About This Home
This home is located at 210 Sunray Ln, Sunnyvale, TX 75182 and is currently estimated at $788,386, approximately $239 per square foot. 210 Sunray Ln is a home located in Dallas County with nearby schools including Sunnyvale Elementary School, Sunnyvale Intermediate School, and Sunnyvale Middle School.
Ownership History
Date
Name
Owned For
Owner Type
Purchase Details
Closed on
Jun 16, 2016
Sold by
Martinez Salomon and Martinez Guadalupe
Bought by
Mendoza Paula
Current Estimated Value
Purchase Details
Closed on
Apr 23, 2015
Sold by
Frost Bank
Bought by
Mendoza Paula
Purchase Details
Closed on
Aug 21, 2009
Sold by
Mccreless Russell Anne
Bought by
Mccreless Russell Anne
Purchase Details
Closed on
Jun 30, 1999
Sold by
Stebbins Richard Kent and Stebbins Shellie A
Bought by
Mccreless Clarence E and Mccreless Russell Anne
Purchase Details
Closed on
Jun 23, 1995
Sold by
Amstar Group Ltd
Bought by
Stebbins Richard Kent and Stebbins Shellie A
Home Financials for this Owner
Home Financials are based on the most recent Mortgage that was taken out on this home.
Original Mortgage
$243,000
Interest Rate
7.77%
Purchase Details
Closed on
Jan 16, 1995
Sold by
Crawford Joey J and Crawford Kimberly R
Bought by
Amstar Group Ltd
Create a Home Valuation Report for This Property
The Home Valuation Report is an in-depth analysis detailing your home's value as well as a comparison with similar homes in the area
Home Values in the Area
Average Home Value in this Area
Purchase History
| Date | Buyer | Sale Price | Title Company |
|---|---|---|---|
| Mendoza Paula | -- | Nat | |
| Mendoza Paula | -- | Rtt | |
| Mccreless Russell Anne | -- | None Available | |
| Mccreless Clarence E | -- | -- | |
| Stebbins Richard Kent | -- | -- | |
| Amstar Group Ltd | -- | -- |
Source: Public Records
Mortgage History
| Date | Status | Borrower | Loan Amount |
|---|---|---|---|
| Previous Owner | Stebbins Richard Kent | $243,000 |
Source: Public Records
Tax History Compared to Growth
Tax History
| Year | Tax Paid | Tax Assessment Tax Assessment Total Assessment is a certain percentage of the fair market value that is determined by local assessors to be the total taxable value of land and additions on the property. | Land | Improvement |
|---|---|---|---|---|
| 2025 | $10,798 | $641,550 | $150,000 | $491,550 |
| 2024 | $10,798 | $641,550 | $150,000 | $491,550 |
| 2023 | $10,798 | $656,120 | $150,000 | $506,120 |
| 2022 | $12,181 | $508,140 | $95,000 | $413,140 |
| 2021 | $10,990 | $455,730 | $76,000 | $379,730 |
| 2020 | $11,328 | $455,730 | $76,000 | $379,730 |
| 2019 | $10,142 | $391,680 | $76,000 | $315,680 |
| 2018 | $10,144 | $391,680 | $76,000 | $315,680 |
| 2017 | $10,144 | $391,680 | $76,000 | $315,680 |
| 2016 | $9,033 | $362,960 | $68,000 | $294,960 |
| 2015 | $3,379 | $300,490 | $68,000 | $232,490 |
| 2014 | $3,379 | $305,140 | $68,000 | $237,140 |
Source: Public Records
Map
Nearby Homes
- 206 Mansfield Blvd
- 200 Suntide Dr
- 296 Ashwood Ln
- 2317 Woodhollow Ave
- 2301 Sweetbriar Ct
- 292 Stone Ridge Dr
- 3049 Tupelo Ln
- 2519 Meadow Ridge Dr
- 2418 Spring Meadow Dr
- 516 Quail Hollow Dr
- 282 Stone Mountain Dr
- 286 Greenhill Ave
- 2312 Heatherdale Dr
- 701 Retriever Ln
- 312 E Tripp Rd
- 608 Shenandoah St
- 728 Violet Ct
- 626 Brittany Dr
- 714 Amesbury Dr
- 2340 Penrose Dr