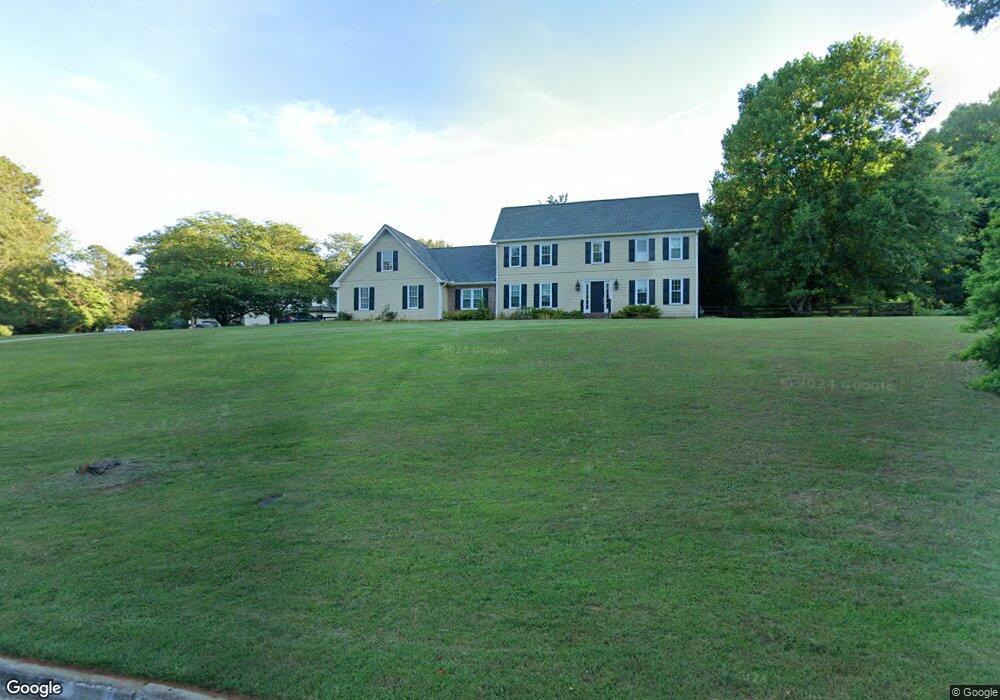
210 Sussex Ct Roswell, GA 30075
Estimated Value: $696,000 - $823,333
4
Beds
4
Baths
3,078
Sq Ft
$252/Sq Ft
Est. Value
About This Home
This home is located at 210 Sussex Ct, Roswell, GA 30075 and is currently estimated at $777,083, approximately $252 per square foot. 210 Sussex Ct is a home located in Fulton County with nearby schools including Mountain Park Elementary School, Crabapple Middle School, and Fellowship Christian School.
Ownership History
Date
Name
Owned For
Owner Type
Purchase Details
Closed on
Aug 30, 2013
Sold by
Gallivan Stephen C
Bought by
Jones Christopher Peter and Walter Barbara Bush
Current Estimated Value
Home Financials for this Owner
Home Financials are based on the most recent Mortgage that was taken out on this home.
Original Mortgage
$338,318
Outstanding Balance
$252,164
Interest Rate
4.37%
Mortgage Type
FHA
Estimated Equity
$524,919
Purchase Details
Closed on
Mar 28, 2002
Sold by
Dassinger Melvin S and Dassinger Mary G
Bought by
Gallivan Stephen C and Gallivan Lynn F
Home Financials for this Owner
Home Financials are based on the most recent Mortgage that was taken out on this home.
Original Mortgage
$158,000
Interest Rate
6.8%
Mortgage Type
New Conventional
Create a Home Valuation Report for This Property
The Home Valuation Report is an in-depth analysis detailing your home's value as well as a comparison with similar homes in the area
Home Values in the Area
Average Home Value in this Area
Purchase History
| Date | Buyer | Sale Price | Title Company |
|---|---|---|---|
| Jones Christopher Peter | $350,000 | -- | |
| Gallivan Stephen C | $252,000 | -- |
Source: Public Records
Mortgage History
| Date | Status | Borrower | Loan Amount |
|---|---|---|---|
| Open | Jones Christopher Peter | $338,318 | |
| Previous Owner | Gallivan Stephen C | $158,000 |
Source: Public Records
Tax History Compared to Growth
Tax History
| Year | Tax Paid | Tax Assessment Tax Assessment Total Assessment is a certain percentage of the fair market value that is determined by local assessors to be the total taxable value of land and additions on the property. | Land | Improvement |
|---|---|---|---|---|
| 2025 | $1,528 | $281,440 | $59,560 | $221,880 |
| 2023 | $6,926 | $245,360 | $26,920 | $218,440 |
| 2022 | $6,455 | $245,360 | $26,920 | $218,440 |
| 2021 | $10,459 | $222,000 | $20,920 | $201,080 |
| 2020 | $4,908 | $149,880 | $23,480 | $126,400 |
| 2019 | $853 | $172,200 | $29,880 | $142,320 |
| 2018 | $4,746 | $168,160 | $29,200 | $138,960 |
| 2017 | $4,536 | $155,480 | $17,280 | $138,200 |
| 2016 | $4,537 | $155,480 | $17,280 | $138,200 |
| 2015 | $5,404 | $155,480 | $17,280 | $138,200 |
| 2014 | $4,101 | $133,800 | $16,520 | $117,280 |
Source: Public Records
Map
Nearby Homes
- 2010 Stonehedge Rd
- 105 Beech Tree Ln
- 11115 Bowen Rd
- 230 Moss Stone Way Unit 2
- 11395 West Rd
- 4405 Village Green Dr
- 5407 Waters Edge Trail
- 5210 Davenport Place
- 11675 Highland Colony Dr Unit 1
- 4201 Village Green Dr
- 1065 Stonegate Ct
- 11775 Highland Colony Dr Unit 1
- 2000 Grande Loch
- 3412 Waters Edge Trail
- 715 Winterwind Way
- 11015 Stroup Rd
- 1820 Azalea Springs Trail
- 1005 Hedgerose Ln
- 11790 Highland Colony Dr
- 11180 West Rd
- 200 Sussex Ct
- 220 Sussex Ct Unit 1
- 0 Waverly Hall Place Unit 7464408
- 0 Waverly Hall Place
- 205 Waverly Hall Place
- 225 Sussex Ct
- 235 Sussex Ct Unit 1
- 215 Sussex Ct Unit 1
- 215 Waverly Hall Place
- 245 Sussex Ct
- 205 Sussex Ct
- 235 Waverly Hall Dr Unit 1
- 225 Waverly Hall Dr Unit 1
- 0 Sussex Ct
- 230 Sussex Ct
- 245 Waverly Hall Dr
- 225 Waverly Hall Place
- 215 Waverly Hall Dr
- 200 Waverly Hall Place
- 1480 Woodstock Rd