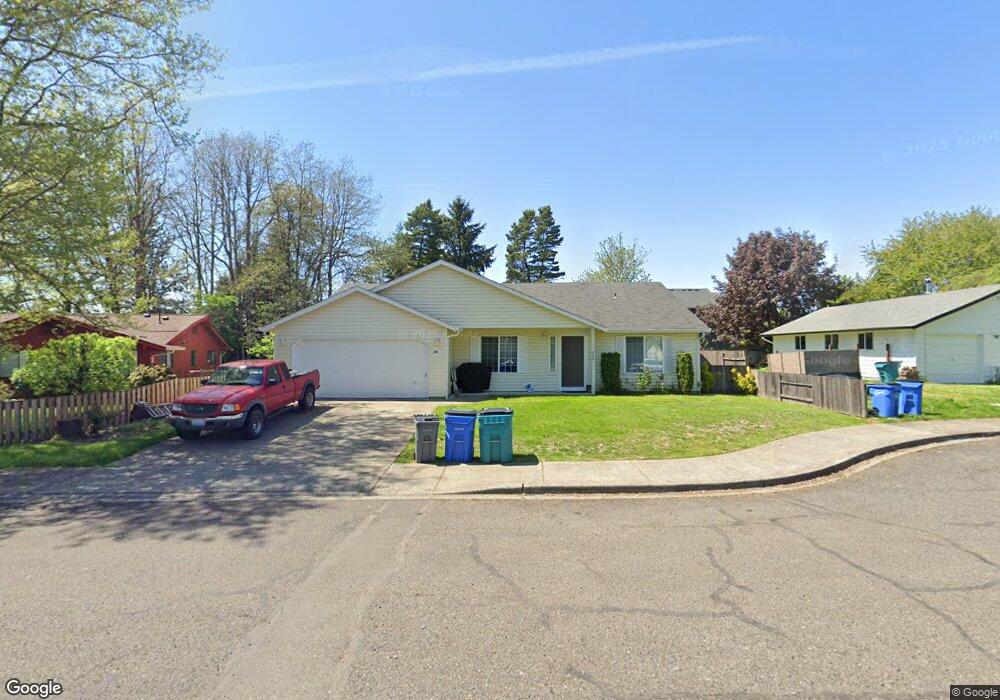
210 SW 4th Ave Battle Ground, WA 98604
Estimated Value: $509,000 - $534,000
3
Beds
2
Baths
1,840
Sq Ft
$285/Sq Ft
Est. Value
About This Home
This home is located at 210 SW 4th Ave, Battle Ground, WA 98604 and is currently estimated at $525,226, approximately $285 per square foot. 210 SW 4th Ave is a home located in Clark County with nearby schools including Captain Strong Primary School, Chief Umtuch Middle School, and Battle Ground High School.
Ownership History
Date
Name
Owned For
Owner Type
Purchase Details
Closed on
Dec 19, 2024
Sold by
Scott Stanley Revocable Living Trust and Stanley Archielyn
Bought by
Archielyn C Stanley Revocable Trust and Stanley
Current Estimated Value
Purchase Details
Closed on
Nov 1, 2018
Sold by
Stanley Scott D
Bought by
The Scott Stanley Revocable Living Trust
Purchase Details
Closed on
Aug 9, 2005
Sold by
Stanley Scott D and Stanley Christine M
Bought by
Big Sky Holdings Llc
Purchase Details
Closed on
Jan 21, 2003
Sold by
Robinson Warren B
Bought by
Stanley Scott D and Stanley Christine
Purchase Details
Closed on
Dec 21, 1999
Sold by
Seppala Enterprises Inc
Bought by
Robinson Warren B
Home Financials for this Owner
Home Financials are based on the most recent Mortgage that was taken out on this home.
Original Mortgage
$50,000
Interest Rate
7.69%
Create a Home Valuation Report for This Property
The Home Valuation Report is an in-depth analysis detailing your home's value as well as a comparison with similar homes in the area
Home Values in the Area
Average Home Value in this Area
Purchase History
| Date | Buyer | Sale Price | Title Company |
|---|---|---|---|
| Archielyn C Stanley Revocable Trust | -- | None Listed On Document | |
| The Scott Stanley Revocable Living Trust | -- | None Available | |
| Big Sky Holdings Llc | -- | Clark County Title Company | |
| Stanley Scott D | $138,000 | Clark County Title | |
| Robinson Warren B | $149,900 | Chicago Title Insurance Co |
Source: Public Records
Mortgage History
| Date | Status | Borrower | Loan Amount |
|---|---|---|---|
| Previous Owner | Robinson Warren B | $50,000 |
Source: Public Records
Tax History Compared to Growth
Tax History
| Year | Tax Paid | Tax Assessment Tax Assessment Total Assessment is a certain percentage of the fair market value that is determined by local assessors to be the total taxable value of land and additions on the property. | Land | Improvement |
|---|---|---|---|---|
| 2025 | $4,208 | $497,494 | $152,102 | $345,392 |
| 2024 | $3,495 | $516,156 | $152,102 | $364,054 |
| 2023 | $3,771 | $487,675 | $152,102 | $335,573 |
| 2022 | $3,459 | $479,839 | $131,781 | $348,058 |
| 2021 | $3,481 | $382,393 | $102,867 | $279,526 |
| 2020 | $3,059 | $352,903 | $97,307 | $255,596 |
| 2019 | $2,552 | $351,465 | $102,867 | $248,598 |
| 2018 | $3,151 | $343,099 | $0 | $0 |
| 2017 | $2,566 | $311,298 | $0 | $0 |
| 2016 | $2,501 | $276,044 | $0 | $0 |
| 2015 | $2,486 | $246,799 | $0 | $0 |
| 2014 | -- | $232,874 | $0 | $0 |
| 2013 | -- | $203,305 | $0 | $0 |
Source: Public Records
Map
Nearby Homes
- 407 SW 32nd St
- 532 SW 23rd St
- 526 SW 23rd St
- 300 SW 7th Ave Unit 704
- 300 SW 7th Ave Unit 905
- 300 SW 7th Ave Unit 211
- 300 SW 7th Ave Unit 302
- 300 SW 7th Ave Unit 127
- 300 SW 7th Ave Unit 102
- 300 SW 7th Ave Unit 1202
- 3309 SE 12th Ave
- 408 S Parkway Ave
- 213 SE 1st Ave
- 301 SW 8th St
- 12 SE 9th Cir
- 3107 4th Ave
- 3111 4th Ave
- 405 SW 10th St
- 637 31st St
- 805 32nd St
- 218 SW 4th Ave
- 202 SW 4th Ave
- 114 SW 4th Place
- 215 SW 4th Ave
- 205 SW 4th Ave
- 203 SW 4th Ave
- 304 SW 4th Ave
- 405 SW 1st St
- 303 SW 4th Ave
- 202 SW 3rd Ave
- 106 SW 4th Place
- 214 SW 3rd Ave
- 104 SW 4th Place
- 114 SW 3rd Ave
- 312 SW 4th Ave
- 311 SW 4th Ave
- 311 SW 4th Ave
- 300 SW 3rd Ave
- 308 SW 3rd Ave
- 301 SW 3rd Ave