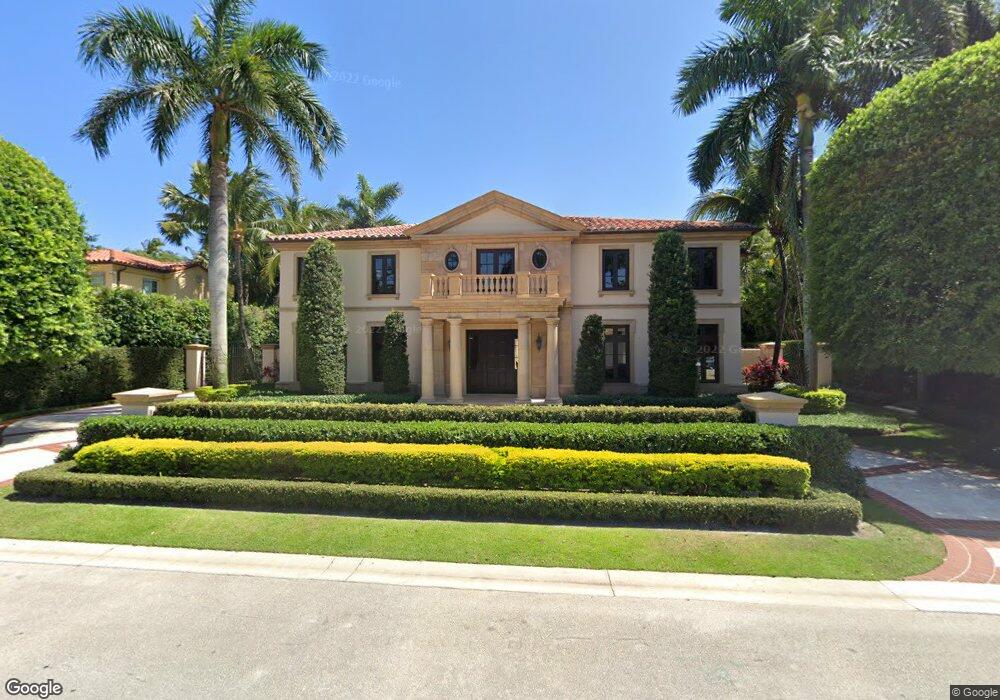
210 Via Tortuga Palm Beach, FL 33480
North End NeighborhoodEstimated Value: $8,977,000
4
Beds
7
Baths
6,410
Sq Ft
$1,400/Sq Ft
Est. Value
About This Home
This home is located at 210 Via Tortuga, Palm Beach, FL 33480 and is currently estimated at $8,977,000, approximately $1,400 per square foot. 210 Via Tortuga is a home located in Palm Beach County with nearby schools including Palm Beach Public School, Conniston Middle School, and Palm Beach Lakes Community High School.
Ownership History
Date
Name
Owned For
Owner Type
Purchase Details
Closed on
Jan 31, 2008
Sold by
Pattswan Ii Llc
Bought by
Pizzagalli James C and Pizzagalli Judith R
Current Estimated Value
Purchase Details
Closed on
Aug 22, 2006
Sold by
Victor Wendy F and Victor Royal
Bought by
Pattswan Ii Llc
Home Financials for this Owner
Home Financials are based on the most recent Mortgage that was taken out on this home.
Original Mortgage
$4,200,000
Interest Rate
6.73%
Mortgage Type
Purchase Money Mortgage
Purchase Details
Closed on
Aug 14, 2006
Sold by
Bessemer Trust Co and Phipps Ogden Mills
Bought by
Victor Wendy F
Home Financials for this Owner
Home Financials are based on the most recent Mortgage that was taken out on this home.
Original Mortgage
$4,200,000
Interest Rate
6.73%
Mortgage Type
Purchase Money Mortgage
Purchase Details
Closed on
Oct 20, 2005
Sold by
Bessemer Trust Co and Janney Stuart S
Bought by
Bessemer Trust Co and Phipps Ogden Mills
Create a Home Valuation Report for This Property
The Home Valuation Report is an in-depth analysis detailing your home's value as well as a comparison with similar homes in the area
Home Values in the Area
Average Home Value in this Area
Purchase History
| Date | Buyer | Sale Price | Title Company |
|---|---|---|---|
| Pizzagalli James C | $4,850,000 | Attorney | |
| Pattswan Ii Llc | $3,500,000 | Attorney | |
| Victor Wendy F | -- | Attorney | |
| Bessemer Trust Co | -- | -- |
Source: Public Records
Mortgage History
| Date | Status | Borrower | Loan Amount |
|---|---|---|---|
| Previous Owner | Pattswan Ii Llc | $4,200,000 |
Source: Public Records
Tax History Compared to Growth
Tax History
| Year | Tax Paid | Tax Assessment Tax Assessment Total Assessment is a certain percentage of the fair market value that is determined by local assessors to be the total taxable value of land and additions on the property. | Land | Improvement |
|---|---|---|---|---|
| 2024 | $94,256 | $6,314,518 | -- | -- |
| 2023 | $92,315 | $6,130,600 | $0 | $0 |
| 2022 | $92,480 | $5,952,039 | $0 | $0 |
| 2021 | $94,052 | $5,778,679 | $0 | $0 |
| 2020 | $94,264 | $5,698,894 | $0 | $0 |
| 2019 | $94,090 | $5,570,766 | $0 | $0 |
| 2018 | $89,368 | $5,466,895 | $0 | $0 |
| 2017 | $89,430 | $5,354,452 | $0 | $0 |
| 2016 | $89,690 | $5,244,321 | $0 | $0 |
| 2015 | $92,761 | $5,207,866 | $0 | $0 |
| 2014 | $93,209 | $5,166,534 | $0 | $0 |
Source: Public Records
Map
Nearby Homes
- 208 Via Tortuga
- 229 Via Las Brisas
- 211 Via Tortuga
- 215 Via Tortuga
- 209 Via Tortuga
- 217 Via Tortuga
- 441 N Lake Way
- 441 N Lake Way
- 441 N Lake Way
- 201 Via Las Brisas
- 223 Via Tortuga
- 236 Miraflores Dr
- 240 Miraflores Dr
- 234 Via Las Brisas
- 230 Miraflores Dr
- 205 Via Tortuga
- 228 Via Las Brisas
- 236 Via Las Brisas
- 256 Miraflores Dr
- 222 Miraflores Dr