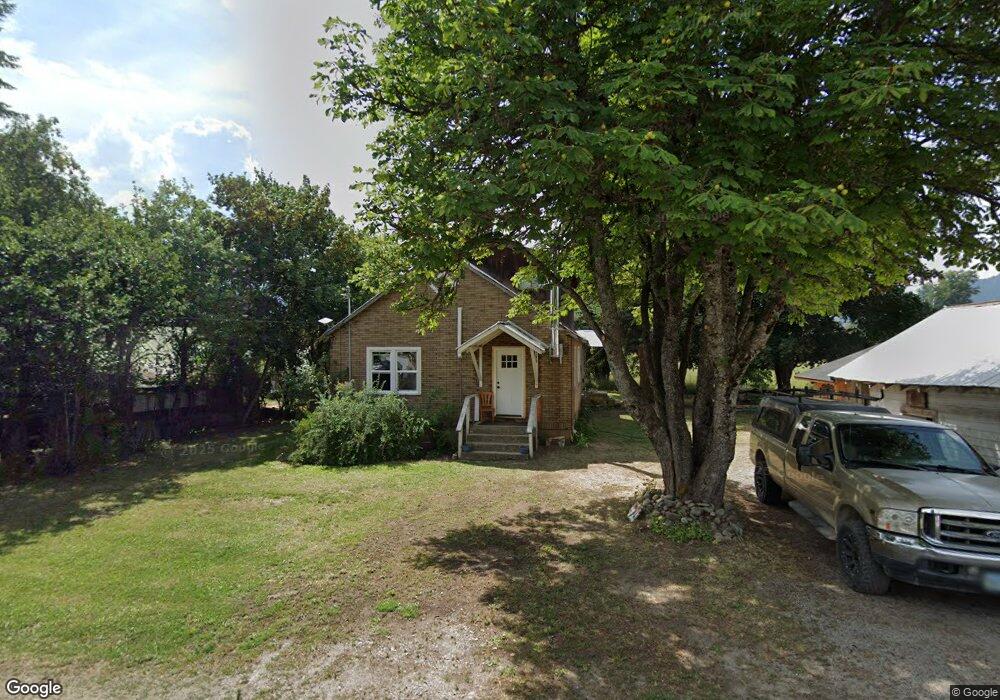
210 W 3rd Ave Clark Fork, ID 83811
Estimated Value: $291,787 - $358,000
2
Beds
1
Bath
1,042
Sq Ft
$304/Sq Ft
Est. Value
About This Home
This home is located at 210 W 3rd Ave, Clark Fork, ID 83811 and is currently estimated at $316,947, approximately $304 per square foot. 210 W 3rd Ave is a home located in Bonner County with nearby schools including Hope Elementary School and Clark Fork Junior/Senior High School.
Ownership History
Date
Name
Owned For
Owner Type
Purchase Details
Closed on
Jan 13, 2017
Sold by
Brixey Bj
Bought by
Montgomery Emma J
Current Estimated Value
Home Financials for this Owner
Home Financials are based on the most recent Mortgage that was taken out on this home.
Original Mortgage
$111,111
Outstanding Balance
$91,144
Interest Rate
4.13%
Mortgage Type
New Conventional
Estimated Equity
$225,803
Purchase Details
Closed on
Jun 2, 2015
Sold by
Olson Tymer J
Bought by
Brixey Bj
Home Financials for this Owner
Home Financials are based on the most recent Mortgage that was taken out on this home.
Original Mortgage
$81,000
Interest Rate
3.62%
Mortgage Type
New Conventional
Purchase Details
Closed on
Aug 9, 2012
Sold by
Linscott Mark Charles
Bought by
Olson Tymer J
Home Financials for this Owner
Home Financials are based on the most recent Mortgage that was taken out on this home.
Original Mortgage
$58,500
Interest Rate
3.62%
Mortgage Type
New Conventional
Create a Home Valuation Report for This Property
The Home Valuation Report is an in-depth analysis detailing your home's value as well as a comparison with similar homes in the area
Home Values in the Area
Average Home Value in this Area
Purchase History
| Date | Buyer | Sale Price | Title Company |
|---|---|---|---|
| Montgomery Emma J | -- | North Idaho Title Company | |
| Brixey Bj | -- | Alliance Title | |
| Olson Tymer J | -- | None Available |
Source: Public Records
Mortgage History
| Date | Status | Borrower | Loan Amount |
|---|---|---|---|
| Open | Montgomery Emma J | $111,111 | |
| Previous Owner | Brixey Bj | $81,000 | |
| Previous Owner | Olson Tymer J | $58,500 |
Source: Public Records
Tax History
| Year | Tax Paid | Tax Assessment Tax Assessment Total Assessment is a certain percentage of the fair market value that is determined by local assessors to be the total taxable value of land and additions on the property. | Land | Improvement |
|---|---|---|---|---|
| 2025 | $1,402 | $247,609 | $103,249 | $144,360 |
| 2024 | $1,411 | $247,609 | $103,249 | $144,360 |
| 2023 | $1,540 | $270,339 | $103,249 | $167,090 |
| 2022 | $1,569 | $247,707 | $57,832 | $189,875 |
| 2021 | $1,407 | $153,407 | $41,760 | $111,647 |
| 2020 | $1,260 | $123,278 | $34,416 | $88,862 |
| 2019 | $1,153 | $130,873 | $34,416 | $96,457 |
| 2018 | $838 | $114,343 | $34,595 | $79,748 |
| 2017 | $838 | $76,328 | $0 | $0 |
| 2016 | $715 | $60,914 | $0 | $0 |
| 2015 | -- | $53,955 | $0 | $0 |
| 2014 | -- | $54,817 | $0 | $0 |
Source: Public Records
Map
Nearby Homes
- 60317 Idaho 200
- NNA Hwy 200
- nna Lightning Creek Rd
- 104 N Mill St
- 102 E 2nd Ave
- 210 E 5th
- 318 E 3rd Ave
- 16 Elk Horn
- NKA Silver Creek Rd
- 940 Sled Run Trail
- 76 Shadow Valley Ln
- 123 E Mountain View Rd
- 58250 Idaho 200
- Tract 3 Usfs 2294
- Tract 4 Usfs 2294
- 773 Cougar Loop
- Tract 5 Usfs 2294
- Tract 6 Usfs 2294
- Usfs Rd 2294
- Tract 7 Usfs 2294
Your Personal Tour Guide
Ask me questions while you tour the home.