Estimated Value: $258,897 - $370,000
--
Bed
--
Bath
--
Sq Ft
0.51
Acres
About This Home
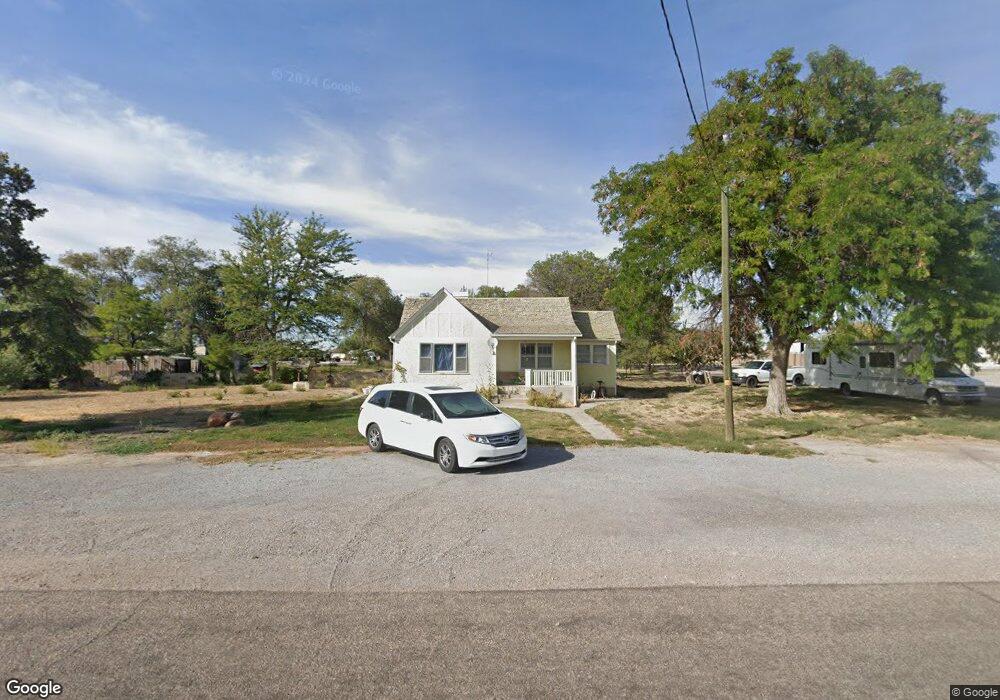
This home is located at 210 W 400 N, Delta, UT 84624 and is currently estimated at $303,974. 210 W 400 N is a home with nearby schools including Cba Center and White River Academy.
Ownership History
Date
Name
Owned For
Owner Type
Purchase Details
Closed on
Mar 24, 2021
Sold by
Lee Kenneth A and Lee Besty K
Bought by
Lee Besty K and Lee Kenneth A
Current Estimated Value
Home Financials for this Owner
Home Financials are based on the most recent Mortgage that was taken out on this home.
Original Mortgage
$120,000
Outstanding Balance
$107,626
Interest Rate
2.73%
Mortgage Type
New Conventional
Estimated Equity
$196,348
Purchase Details
Closed on
Jan 26, 2016
Sold by
Hansen Management Trust
Bought by
Lee Kenneth A and Lee Betsy K
Home Financials for this Owner
Home Financials are based on the most recent Mortgage that was taken out on this home.
Original Mortgage
$64,500
Interest Rate
3.94%
Mortgage Type
New Conventional
Create a Home Valuation Report for This Property
The Home Valuation Report is an in-depth analysis detailing your home's value as well as a comparison with similar homes in the area
Home Values in the Area
Average Home Value in this Area
Purchase History
| Date | Buyer | Sale Price | Title Company |
|---|---|---|---|
| Lee Besty K | -- | First American Title | |
| Lee Kenneth A | -- | First American Title |
Source: Public Records
Mortgage History
| Date | Status | Borrower | Loan Amount |
|---|---|---|---|
| Open | Lee Besty K | $120,000 | |
| Closed | Lee Kenneth A | $64,500 |
Source: Public Records
Tax History Compared to Growth
Tax History
| Year | Tax Paid | Tax Assessment Tax Assessment Total Assessment is a certain percentage of the fair market value that is determined by local assessors to be the total taxable value of land and additions on the property. | Land | Improvement |
|---|---|---|---|---|
| 2025 | $1,237 | $132,141 | $20,896 | $111,245 |
| 2024 | $1,237 | $87,811 | $9,432 | $78,379 |
| 2023 | $1,159 | $87,811 | $9,432 | $78,379 |
| 2022 | $786 | $59,084 | $8,575 | $50,509 |
| 2021 | $679 | $48,688 | $7,456 | $41,232 |
| 2020 | $632 | $45,004 | $6,778 | $38,226 |
| 2019 | $627 | $44,714 | $6,276 | $38,438 |
| 2018 | $578 | $41,540 | $6,276 | $35,264 |
| 2017 | $597 | $41,357 | $6,093 | $35,264 |
| 2016 | $578 | $41,357 | $6,093 | $35,264 |
| 2015 | $577 | $41,357 | $6,093 | $35,264 |
| 2014 | -- | $39,114 | $6,093 | $33,021 |
| 2013 | -- | $39,114 | $6,093 | $33,021 |
Source: Public Records
Map
Nearby Homes