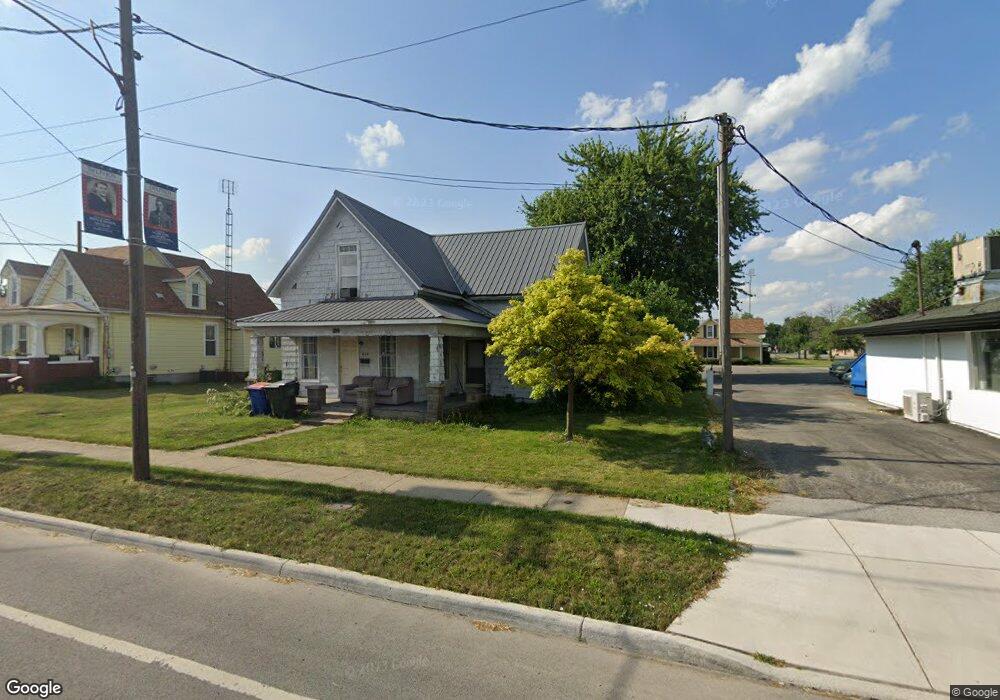
210 W 5th St Delphos, OH 45833
Estimated Value: $90,000 - $157,000
3
Beds
1
Bath
1,870
Sq Ft
$68/Sq Ft
Est. Value
About This Home
This home is located at 210 W 5th St, Delphos, OH 45833 and is currently estimated at $127,636, approximately $68 per square foot. 210 W 5th St is a home located in Van Wert County with nearby schools including Delphos St. John's High School and Delphos St. John's Elementary School.
Ownership History
Date
Name
Owned For
Owner Type
Purchase Details
Closed on
Apr 17, 2025
Sold by
Altenburger Michele L
Bought by
Bab 3G Llc
Current Estimated Value
Purchase Details
Closed on
Jun 5, 2019
Sold by
Nijak David and Dickman Joan M
Bought by
Altenburger Brian J and Altenburger Michele L
Home Financials for this Owner
Home Financials are based on the most recent Mortgage that was taken out on this home.
Original Mortgage
$32,000
Interest Rate
4.2%
Mortgage Type
Commercial
Purchase Details
Closed on
Jun 17, 2017
Sold by
Dickman Joan M and Nijak David
Bought by
Altenburger Brian J
Home Financials for this Owner
Home Financials are based on the most recent Mortgage that was taken out on this home.
Original Mortgage
$39,500
Interest Rate
5%
Mortgage Type
Seller Take Back
Purchase Details
Closed on
Dec 31, 1996
Bought by
Dickman Joan M
Create a Home Valuation Report for This Property
The Home Valuation Report is an in-depth analysis detailing your home's value as well as a comparison with similar homes in the area
Home Values in the Area
Average Home Value in this Area
Purchase History
| Date | Buyer | Sale Price | Title Company |
|---|---|---|---|
| Bab 3G Llc | -- | None Listed On Document | |
| Altenburger Michele L | -- | None Listed On Document | |
| Altenburger Brian J | -- | None Listed On Document | |
| Altenburger Brian J | $41,500 | None Available | |
| Altenburger Brian J | $41,500 | Attorney | |
| Dickman Joan M | $29,500 | -- |
Source: Public Records
Mortgage History
| Date | Status | Borrower | Loan Amount |
|---|---|---|---|
| Previous Owner | Altenburger Brian J | $32,000 | |
| Previous Owner | Altenburger Brian J | $39,500 |
Source: Public Records
Tax History Compared to Growth
Tax History
| Year | Tax Paid | Tax Assessment Tax Assessment Total Assessment is a certain percentage of the fair market value that is determined by local assessors to be the total taxable value of land and additions on the property. | Land | Improvement |
|---|---|---|---|---|
| 2024 | $988 | $34,070 | $3,780 | $30,290 |
| 2023 | $988 | $34,070 | $3,780 | $30,290 |
| 2022 | $755 | $23,660 | $2,980 | $20,680 |
| 2021 | $757 | $23,660 | $2,980 | $20,680 |
| 2020 | $781 | $23,660 | $2,980 | $20,680 |
| 2019 | $629 | $21,270 | $2,980 | $18,290 |
| 2018 | $634 | $21,270 | $2,980 | $18,290 |
| 2017 | $634 | $21,270 | $2,980 | $18,290 |
| 2016 | $558 | $19,100 | $2,980 | $16,120 |
| 2015 | $558 | $19,100 | $2,980 | $16,120 |
| 2014 | $585 | $19,100 | $2,980 | $16,120 |
| 2013 | $624 | $19,100 | $2,980 | $16,120 |
Source: Public Records
Map
Nearby Homes
- 610 N Washington St
- 503 W 6th St
- 405 N Franklin St
- 210 E 3rd St
- 604 W 6th St
- 409 N Bredeick St
- 616 W 5th St
- 704 N Franklin St
- 810 N Franklin St
- 628 N Pierce St
- 221 S Main St
- 650 E 6th St
- 633 E 2nd St
- 424 S Canal St
- 821 E 3rd St
- 903 E 3rd St
- 606 S Cass St
- 914 E 3rd St
- 508 S Washington St
- 634 S Clay St