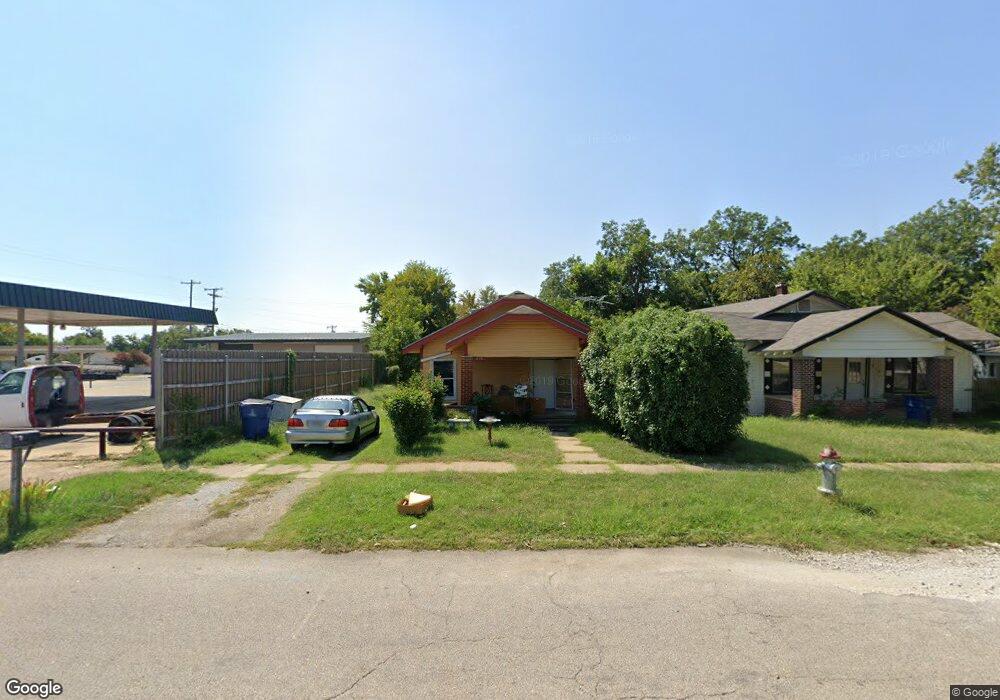
210 W Heron St Denison, TX 75020
Estimated Value: $111,000 - $125,240
2
Beds
1
Bath
984
Sq Ft
$120/Sq Ft
Est. Value
About This Home
This home is located at 210 W Heron St, Denison, TX 75020 and is currently estimated at $118,120, approximately $120 per square foot. 210 W Heron St is a home located in Grayson County with nearby schools including Scott Middle School, Denison High School, and St. Luke's Parish Day School.
Ownership History
Date
Name
Owned For
Owner Type
Purchase Details
Closed on
Mar 30, 2019
Sold by
Texoma S & D Properties Inc
Bought by
Bonilla Fabian Jose Julian and Martinez Wendy Nohemy Gonzalez
Current Estimated Value
Home Financials for this Owner
Home Financials are based on the most recent Mortgage that was taken out on this home.
Original Mortgage
$49,750
Interest Rate
4.1%
Mortgage Type
Purchase Money Mortgage
Purchase Details
Closed on
Oct 1, 2018
Sold by
Brock Sherry Ann
Bought by
Texoma S & D Properties Inc
Purchase Details
Closed on
Oct 20, 2010
Sold by
Tierra Group Llc
Bought by
Brock Charles M and Brock Sherry Ann
Home Financials for this Owner
Home Financials are based on the most recent Mortgage that was taken out on this home.
Original Mortgage
$21,600
Interest Rate
4.36%
Mortgage Type
Purchase Money Mortgage
Purchase Details
Closed on
Jul 23, 2010
Sold by
Cook Michael S
Bought by
Tierra Group Llc
Create a Home Valuation Report for This Property
The Home Valuation Report is an in-depth analysis detailing your home's value as well as a comparison with similar homes in the area
Home Values in the Area
Average Home Value in this Area
Purchase History
| Date | Buyer | Sale Price | Title Company |
|---|---|---|---|
| Bonilla Fabian Jose Julian | -- | None Available | |
| Texoma S & D Properties Inc | -- | Grayson County Title | |
| Brock Charles M | -- | None Available | |
| Tierra Group Llc | -- | Grayson County Title |
Source: Public Records
Mortgage History
| Date | Status | Borrower | Loan Amount |
|---|---|---|---|
| Previous Owner | Bonilla Fabian Jose Julian | $49,750 | |
| Previous Owner | Brock Charles M | $21,600 |
Source: Public Records
Tax History Compared to Growth
Tax History
| Year | Tax Paid | Tax Assessment Tax Assessment Total Assessment is a certain percentage of the fair market value that is determined by local assessors to be the total taxable value of land and additions on the property. | Land | Improvement |
|---|---|---|---|---|
| 2025 | $853 | $85,806 | -- | -- |
| 2024 | $1,812 | $78,005 | $0 | $0 |
| 2023 | $2,021 | $70,914 | $34,950 | $54,232 |
| 2022 | $1,835 | $77,228 | $31,050 | $46,178 |
| 2021 | $1,478 | $58,606 | $20,625 | $37,981 |
| 2020 | $1,431 | $54,251 | $15,000 | $39,251 |
| 2019 | $1,362 | $49,502 | $9,000 | $40,502 |
| 2018 | $1,053 | $47,380 | $6,000 | $41,380 |
| 2017 | $966 | $41,591 | $2,400 | $39,191 |
| 2016 | $878 | $36,869 | $2,400 | $34,469 |
| 2015 | $163 | $28,528 | $2,400 | $26,128 |
| 2014 | $163 | $28,528 | $2,400 | $26,128 |
Source: Public Records
Map
Nearby Homes
- TBD S Austin Ave
- 221 W Monterey St
- 231 W Murray St
- 309 W Monterey St
- 111 W Murray St
- 330 W Texas St
- 328 W Murray St
- 408 W Heron St
- 415 W Monterey St
- 101 E Murray St
- 1110 S Houston Ave
- 1414 S Houston Ave
- 513 W Murray St
- 129 Texas E
- 509 W Acheson St
- 513 W Texas St
- 110 E Munson St
- 430 W Munson St
- 326 W Day St
- 525 W Hanna St
- 214 W Heron St
- 218 W Heron St
- 220 W Heron St
- 215 W Murray St
- 217 W Murray St
- 226 W Heron St
- 213 W Heron St
- 223 W Murray St
- 215 W Heron St
- 1217 S Austin Ave Unit 102
- 1217 S Austin Ave Unit 103
- 230 W Heron St
- 219 W Heron St
- 227 W Murray St
- 227 W Murray St
- 225 W Heron St
- 115 W Heron St
- N/a S Austin Ave
- 231 W Heron St
- 120 W Heron St