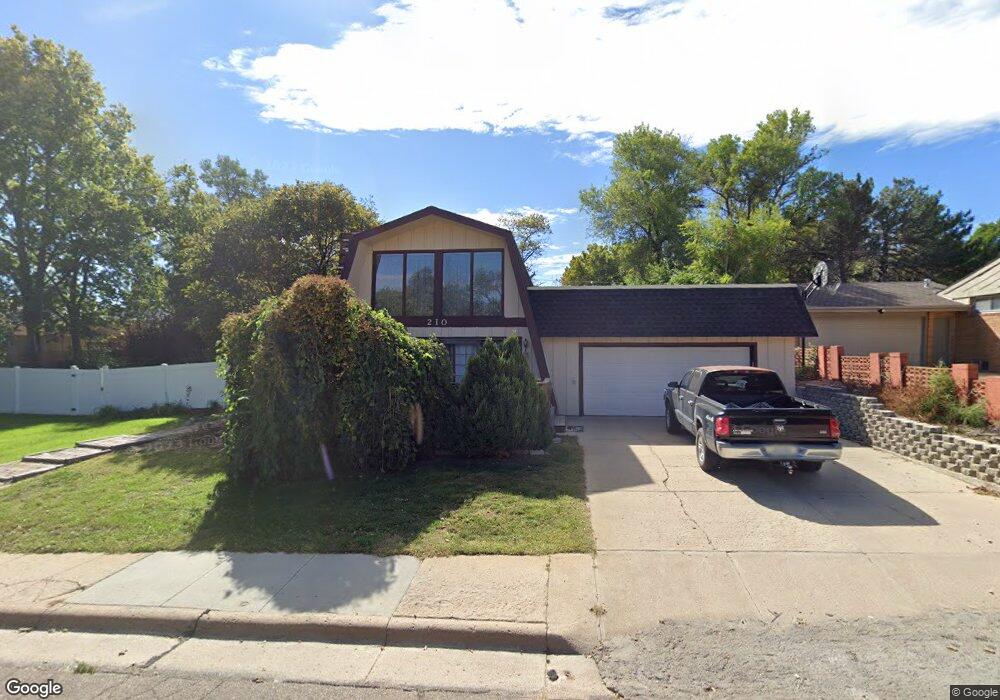
210 W P St Mc Cook, NE 69001
Estimated Value: $215,000 - $254,000
2
Beds
2
Baths
1,951
Sq Ft
$122/Sq Ft
Est. Value
About This Home
This home is located at 210 W P St, Mc Cook, NE 69001 and is currently estimated at $237,589, approximately $121 per square foot. 210 W P St is a home located in Red Willow County with nearby schools including McCook Elementary School, Central Elementary School, and McCook Junior High School.
Ownership History
Date
Name
Owned For
Owner Type
Purchase Details
Closed on
Jul 7, 2017
Sold by
Walbridge Jodee
Bought by
Zuck Allen and Zuck Cassidy
Current Estimated Value
Home Financials for this Owner
Home Financials are based on the most recent Mortgage that was taken out on this home.
Original Mortgage
$144,444
Outstanding Balance
$119,391
Interest Rate
3.88%
Mortgage Type
New Conventional
Estimated Equity
$118,198
Create a Home Valuation Report for This Property
The Home Valuation Report is an in-depth analysis detailing your home's value as well as a comparison with similar homes in the area
Home Values in the Area
Average Home Value in this Area
Purchase History
| Date | Buyer | Sale Price | Title Company |
|---|---|---|---|
| Zuck Allen | $143,000 | Mccook Abstract Company |
Source: Public Records
Mortgage History
| Date | Status | Borrower | Loan Amount |
|---|---|---|---|
| Open | Zuck Allen | $144,444 |
Source: Public Records
Tax History
| Year | Tax Paid | Tax Assessment Tax Assessment Total Assessment is a certain percentage of the fair market value that is determined by local assessors to be the total taxable value of land and additions on the property. | Land | Improvement |
|---|---|---|---|---|
| 2025 | $2,641 | $209,396 | $24,820 | $184,576 |
| 2024 | $2,641 | $201,712 | $24,820 | $176,892 |
| 2023 | $3,147 | $191,165 | $24,820 | $166,345 |
| 2022 | $3,067 | $175,473 | $21,300 | $154,173 |
| 2021 | $2,909 | $159,663 | $21,300 | $138,363 |
| 2020 | $2,779 | $152,630 | $10,700 | $141,930 |
| 2019 | $2,759 | $152,630 | $10,700 | $141,930 |
| 2018 | $2,723 | $152,630 | $10,700 | $141,930 |
| 2017 | $2,639 | $152,630 | $10,700 | $141,930 |
| 2016 | $2,409 | $139,727 | $10,700 | $129,027 |
| 2015 | $2,345 | $139,727 | $10,700 | $129,027 |
| 2014 | $2,364 | $134,221 | $10,700 | $123,521 |
Source: Public Records
Map
Nearby Homes
Your Personal Tour Guide
Ask me questions while you tour the home.