Estimated Value: $199,454 - $237,000
--
Bed
--
Bath
1,300
Sq Ft
$166/Sq Ft
Est. Value
About This Home
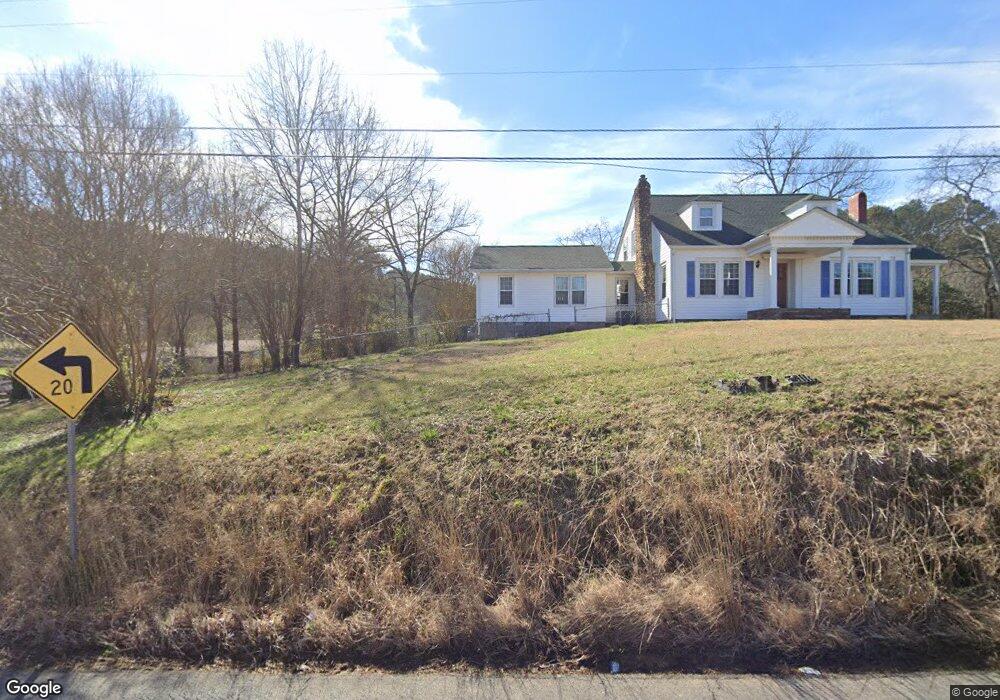
This home is located at 210 Wayside Rd NE, Rome, GA 30161 and is currently estimated at $215,364, approximately $165 per square foot. 210 Wayside Rd NE is a home located in Floyd County with nearby schools including Model Middle School, Model High School, and Unity Christian School.
Ownership History
Date
Name
Owned For
Owner Type
Purchase Details
Closed on
Aug 20, 2015
Sold by
Oyler Shirley Ann
Bought by
Champion Johnathan
Current Estimated Value
Home Financials for this Owner
Home Financials are based on the most recent Mortgage that was taken out on this home.
Original Mortgage
$81,326
Outstanding Balance
$64,093
Interest Rate
4.09%
Mortgage Type
New Conventional
Estimated Equity
$151,271
Purchase Details
Closed on
Jun 20, 2005
Sold by
Oyler Gregory Don and Oyler Shirley Oy
Bought by
Oyler Shirley
Purchase Details
Closed on
Jun 3, 2002
Sold by
Oyler Gregory Don
Bought by
Oyler Gregory Don and Shirley Oyler
Purchase Details
Closed on
Oct 31, 1975
Sold by
Smith Robt Harold
Bought by
Ray Bobby L
Purchase Details
Closed on
Oct 21, 1974
Sold by
Mccall Lou Gray
Bought by
Smith Robt Harold
Purchase Details
Closed on
Jan 12, 1909
Bought by
Mccall Lou Gray
Create a Home Valuation Report for This Property
The Home Valuation Report is an in-depth analysis detailing your home's value as well as a comparison with similar homes in the area
Home Values in the Area
Average Home Value in this Area
Purchase History
| Date | Buyer | Sale Price | Title Company |
|---|---|---|---|
| Champion Johnathan | $79,700 | -- | |
| Oyler Shirley | -- | -- | |
| Oyler Gregory Don | -- | -- | |
| Oyler Gregory Don | $85,000 | -- | |
| Ray Bobby L | $22,500 | -- | |
| Smith Robt Harold | $17,000 | -- | |
| Mccall Lou Gray | -- | -- |
Source: Public Records
Mortgage History
| Date | Status | Borrower | Loan Amount |
|---|---|---|---|
| Open | Champion Johnathan | $81,326 |
Source: Public Records
Tax History Compared to Growth
Tax History
| Year | Tax Paid | Tax Assessment Tax Assessment Total Assessment is a certain percentage of the fair market value that is determined by local assessors to be the total taxable value of land and additions on the property. | Land | Improvement |
|---|---|---|---|---|
| 2024 | $2,437 | $78,336 | $8,932 | $69,404 |
| 2023 | $2,241 | $66,478 | $8,120 | $58,358 |
| 2022 | $1,617 | $54,504 | $6,636 | $47,868 |
| 2021 | $1,307 | $43,297 | $6,050 | $37,247 |
| 2020 | $1,162 | $38,168 | $5,261 | $32,907 |
| 2019 | $1,116 | $37,157 | $5,261 | $31,896 |
| 2018 | $1,077 | $35,811 | $5,011 | $30,800 |
| 2017 | $1,026 | $34,048 | $4,640 | $29,408 |
| 2016 | $973 | $34,470 | $4,600 | $29,870 |
| 2015 | $917 | $34,470 | $4,600 | $29,870 |
| 2014 | $917 | $34,470 | $4,600 | $29,870 |
Source: Public Records
Map
Nearby Homes
- 197 Wayside Rd NE
- 5 Larkwood Dr NE
- 424 Wayside Rd NE
- 0 Calhoun Rd NE Unit 7516251
- 0 Calhoun Rd NE Unit 10488821
- 109 Dekle Dr NE
- 608 Wayside Rd NE
- 118 Dekle Dr NE
- 108 Dekle Dr NE
- 3 Dekle Dr NE
- 16 Maycroft Ct
- 13 Maycroft Ct
- 637 Wayside Rd NE
- 26 Greer Dr NE
- 0 Scarlett Ln Unit 10548767
- 0 Scarlett Ln Unit 7601914
- 58 Wade St NE
- 0 Carrington Place NE Unit 7512224
- 0 Carrington Place NE Unit 10443994
- 16 Barnesdale Way NE
- 194 Wayside Rd NE
- 212 Wayside Rd NE
- 170 Wayside Rd NE
- 170 Wayside Rd NE
- 2228 Wayside Rd
- 0 Wildwood Ln NE Unit 8223625
- 0 Wildwood Ln NE
- 0 Wildwood Ln NE Unit 6974180
- 0 Wildwood Ln NE Unit 20003010
- 0 Wildwood Ln NE Unit 5878152
- 3305 Wayside Rd
- 197 Wayside Rd NE
- 215 Wayside Rd NE
- 1 Chula Vista Dr NE
- 4 Wildwood Ln NE
- 255 Wayside Rd NE
- 153 Wayside Rd NE
- 3 Chula Vista Dr NE
- 134 Wayside Rd NE
- 134 Wayside Rd NE