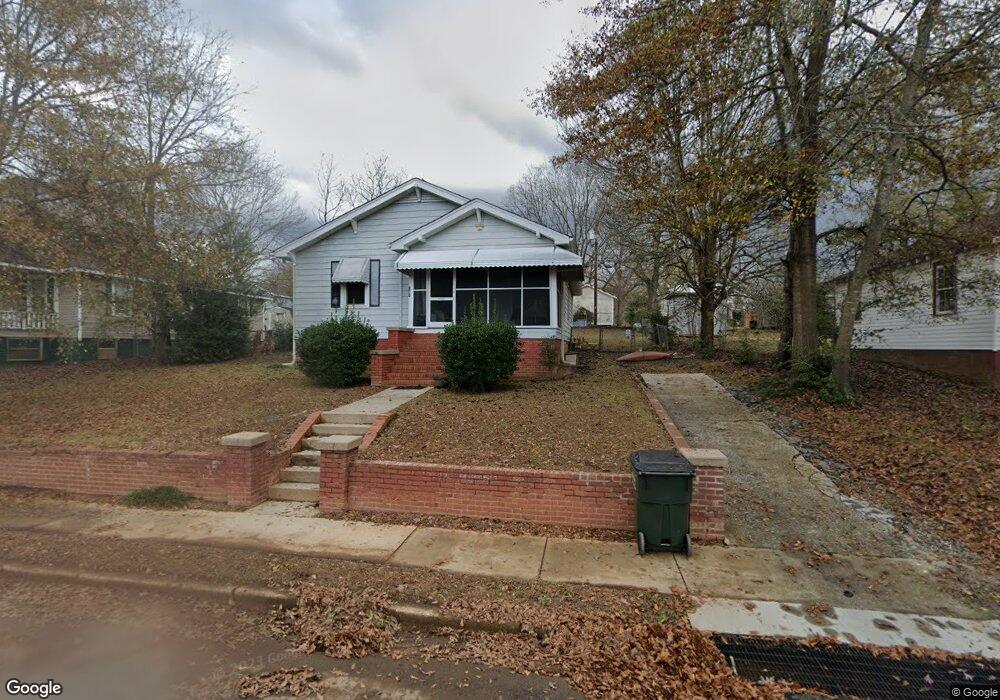
210 Webster St Slater, SC 29683
Slater-Marietta NeighborhoodEstimated Value: $154,000 - $194,000
3
Beds
1
Bath
1,350
Sq Ft
$131/Sq Ft
Est. Value
About This Home
This home is located at 210 Webster St, Slater, SC 29683 and is currently estimated at $177,432, approximately $131 per square foot. 210 Webster St is a home located in Greenville County with nearby schools including Slater Marietta Elementary School, Northwest Middle School, and Travelers Rest High School.
Ownership History
Date
Name
Owned For
Owner Type
Purchase Details
Closed on
Dec 28, 2016
Sold by
Schmietendorf Paula and Schlaudt Roy
Bought by
Mccray Anie Lynn
Current Estimated Value
Home Financials for this Owner
Home Financials are based on the most recent Mortgage that was taken out on this home.
Original Mortgage
$71,250
Outstanding Balance
$57,678
Interest Rate
3.94%
Mortgage Type
New Conventional
Estimated Equity
$119,754
Purchase Details
Closed on
Jan 30, 2014
Sold by
Johnson Clyde and Johnson Yvonne M
Bought by
Schmietendorf Paula and Schlaudt Roy
Purchase Details
Closed on
Nov 1, 2012
Sold by
Garrett Rodney A
Bought by
Johnson Yvonne M
Purchase Details
Closed on
Oct 19, 2012
Sold by
Johnson Yvonne M
Bought by
Johnson Clyde and Johnson Yvonne M
Purchase Details
Closed on
Jul 8, 2004
Sold by
Garrett Billy A
Bought by
Garrett Irene C
Create a Home Valuation Report for This Property
The Home Valuation Report is an in-depth analysis detailing your home's value as well as a comparison with similar homes in the area
Home Values in the Area
Average Home Value in this Area
Purchase History
| Date | Buyer | Sale Price | Title Company |
|---|---|---|---|
| Mccray Anie Lynn | $75,000 | None Available | |
| Schmietendorf Paula | $30,000 | -- | |
| Johnson Yvonne M | -- | -- | |
| Johnson Clyde | -- | -- | |
| Garrett Rodney A | -- | -- | |
| Garrett Irene C | -- | -- |
Source: Public Records
Mortgage History
| Date | Status | Borrower | Loan Amount |
|---|---|---|---|
| Open | Mccray Anie Lynn | $71,250 |
Source: Public Records
Tax History
| Year | Tax Paid | Tax Assessment Tax Assessment Total Assessment is a certain percentage of the fair market value that is determined by local assessors to be the total taxable value of land and additions on the property. | Land | Improvement |
|---|---|---|---|---|
| 2025 | $565 | $3,690 | $710 | $2,980 |
| 2024 | $565 | $3,210 | $610 | $2,600 |
| 2023 | $526 | $3,210 | $610 | $2,600 |
| 2022 | $508 | $3,210 | $610 | $2,600 |
| 2021 | $511 | $3,210 | $610 | $2,600 |
| 2020 | $445 | $2,790 | $320 | $2,470 |
| 2019 | $445 | $2,790 | $320 | $2,470 |
| 2018 | $467 | $2,790 | $320 | $2,470 |
| 2017 | $467 | $2,790 | $320 | $2,470 |
| 2016 | $572 | $31,160 | $8,000 | $23,160 |
| 2015 | $882 | $50,180 | $8,000 | $42,180 |
| 2014 | $931 | $53,820 | $10,000 | $43,820 |
Source: Public Records
Map
Nearby Homes
- 4 Laurel Ln
- 00 Geer Hwy
- 210 Midway Dr
- 704 Slater Rd
- 145 Bates Rd
- 157 Saw Mill Rd
- 114 Oakland Ave
- 107 Eagles Crest Dr
- 705 Dacusville Rd
- 108 Linda Ln
- 539 Hart Cut Rd
- 200 Eagles Crest Dr
- 36 Key Hollow Ln
- 111 Bates Rd
- 130 Dogwood Terrace
- 427 Circle Dr
- 1070 Bates Crossing Rd
- 458A Bates Crossing Rd
- 198 Valley Rd
- 7 Valley Rd
- 212 Webster St
- 411 Lindbergh St
- 214 Webster St
- 409 Lindbergh St
- 211 Webster St
- 209 Webster St
- 413 Lindbergh St
- 213 Webster St
- 211 Webster St S
- 407 Lindbergh St
- 204 Webster St
- 415 Lindbergh St
- 216 Webster St S
- 207 Webster St
- 216 Webster St
- 215 Webster St
- 215 Webster St
- 405 Lindberg St
- 405 Lindberg St
- 405 Lindbergh St
Your Personal Tour Guide
Ask me questions while you tour the home.