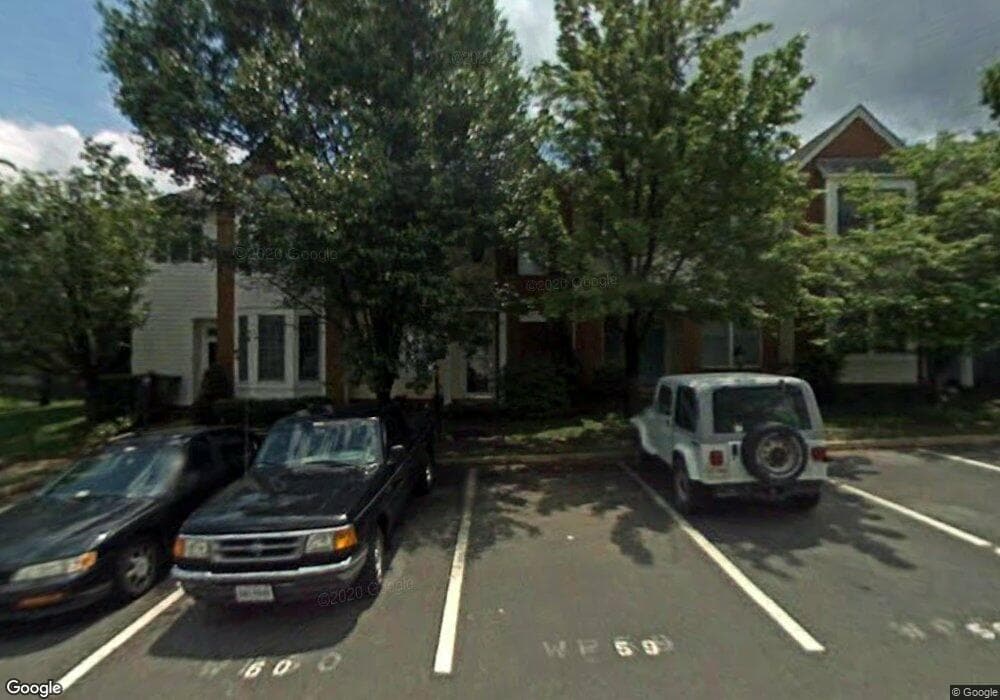
210 West Park Dr Stafford, VA 22554
Embrey Mill NeighborhoodEstimated Value: $333,000 - $362,000
2
Beds
3
Baths
1,694
Sq Ft
$206/Sq Ft
Est. Value
About This Home
This home is located at 210 West Park Dr, Stafford, VA 22554 and is currently estimated at $348,456, approximately $205 per square foot. 210 West Park Dr is a home located in Stafford County with nearby schools including Park Ridge Elementary School, Rodney E. Thompson Middle School, and North Stafford High School.
Ownership History
Date
Name
Owned For
Owner Type
Purchase Details
Closed on
Apr 27, 2022
Sold by
King Cheryl L
Bought by
Umah Wisdom
Current Estimated Value
Purchase Details
Closed on
May 7, 2007
Sold by
Mullin Lawrence
Bought by
King Cheryl
Home Financials for this Owner
Home Financials are based on the most recent Mortgage that was taken out on this home.
Original Mortgage
$266,000
Interest Rate
6.23%
Mortgage Type
New Conventional
Purchase Details
Closed on
Sep 15, 2003
Sold by
White Samuel
Bought by
Premier Enterprise
Home Financials for this Owner
Home Financials are based on the most recent Mortgage that was taken out on this home.
Original Mortgage
$114,000
Interest Rate
6.22%
Mortgage Type
Construction
Purchase Details
Closed on
May 31, 2002
Sold by
Light Mark
Bought by
Rinehart Timmie
Home Financials for this Owner
Home Financials are based on the most recent Mortgage that was taken out on this home.
Original Mortgage
$128,520
Interest Rate
7%
Mortgage Type
Purchase Money Mortgage
Create a Home Valuation Report for This Property
The Home Valuation Report is an in-depth analysis detailing your home's value as well as a comparison with similar homes in the area
Home Values in the Area
Average Home Value in this Area
Purchase History
| Date | Buyer | Sale Price | Title Company |
|---|---|---|---|
| Umah Wisdom | $300,000 | First American Title | |
| King Cheryl | $266,000 | -- | |
| Premier Enterprise | $117,000 | -- | |
| Rinehart Timmie | $126,000 | -- |
Source: Public Records
Mortgage History
| Date | Status | Borrower | Loan Amount |
|---|---|---|---|
| Previous Owner | King Cheryl | $266,000 | |
| Previous Owner | Premier Enterprise | $114,000 | |
| Previous Owner | Rinehart Timmie | $128,520 |
Source: Public Records
Tax History Compared to Growth
Tax History
| Year | Tax Paid | Tax Assessment Tax Assessment Total Assessment is a certain percentage of the fair market value that is determined by local assessors to be the total taxable value of land and additions on the property. | Land | Improvement |
|---|---|---|---|---|
| 2025 | $2,312 | $255,000 | $100,000 | $155,000 |
| 2024 | $2,312 | $255,000 | $100,000 | $155,000 |
| 2023 | $1,992 | $210,800 | $80,000 | $130,800 |
| 2022 | $1,792 | $210,800 | $80,000 | $130,800 |
| 2021 | $1,615 | $166,500 | $65,000 | $101,500 |
| 2020 | $1,615 | $166,500 | $65,000 | $101,500 |
| 2019 | $1,620 | $160,400 | $65,000 | $95,400 |
| 2018 | $1,588 | $160,400 | $65,000 | $95,400 |
| 2017 | $1,538 | $155,400 | $60,000 | $95,400 |
| 2016 | $1,538 | $155,400 | $60,000 | $95,400 |
| 2015 | -- | $143,600 | $60,000 | $83,600 |
| 2014 | -- | $143,600 | $60,000 | $83,600 |
Source: Public Records
Map
Nearby Homes
- 311 W Park Dr
- 412 W Park Dr
- 8 Fulton Dr
- 13 Joplin Ct
- 1 Jonquil Place
- 4 Candleridge Ct
- 41 Meadowood Dr
- 2 David Ct
- 101 Waters Landing
- 35 Woods Edge Ct
- 38 Woods Edge Ct
- 1 Ashbrook Rd
- 10 Sarasota Dr
- 1 Stoneridge Ct
- 15 Stoneridge Ct
- 17 Stoneridge Ct
- 1 Sturbridge Ln
- 7 Lee Ct
- 12 Heatherbrook Ln
- 200 Via de Rosa Dr
- 210 W Park Dr
- 212 W Park Dr
- 208 West Park Dr
- 212 West Park Dr
- 206 W Park Dr
- 206 West Park Dr
- 204 W Park Dr
- 204 West Park Dr
- 202 West Park Dr
- 130 Hedgeapple Ct
- 200 W Park Dr
- 128 Hedgeapple Ct
- 200 West Park Dr
- 302 West Park Dr
- 301 Waters Cove Ct
- 302 W Park Dr
- 126 Hedgeapple Ct
- 304 W Park Dr
- 304 West Park Dr
- 303 Waters Cove Ct