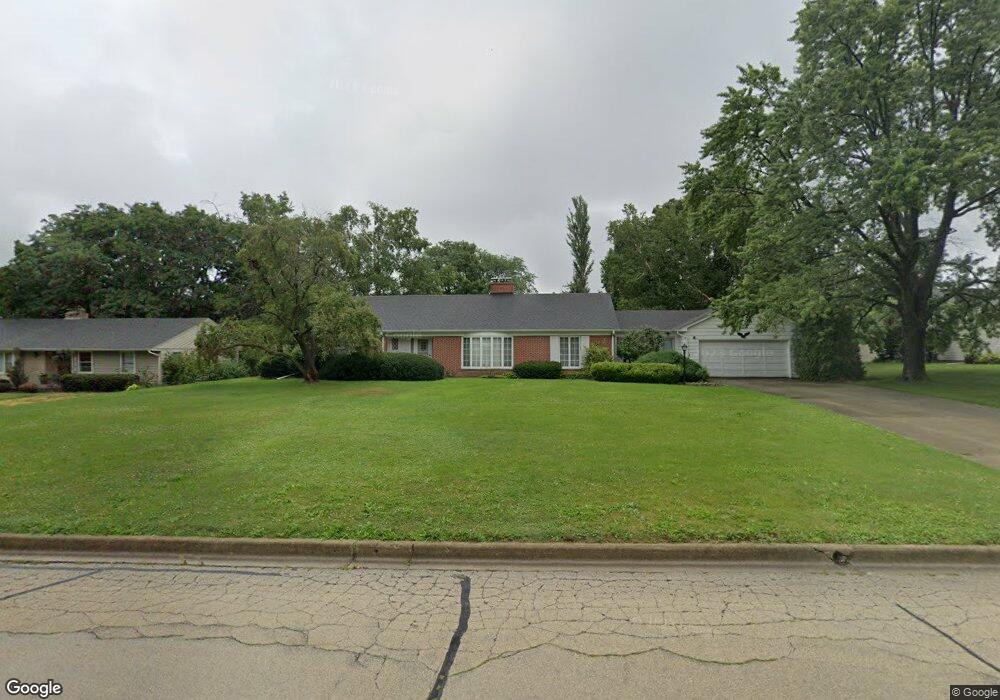
210 Windsor Dr Dekalb, IL 60115
Estimated Value: $297,595 - $373,000
Studio
--
Bath
--
Sq Ft
0.54
Acres Lot
About This Home
This home is located at 210 Windsor Dr, Dekalb, IL 60115 and is currently estimated at $335,149. 210 Windsor Dr is a home located in DeKalb County with nearby schools including Jefferson Elementary School, Clinton Rosette Middle School, and De Kalb High School.
Ownership History
Date
Name
Owned For
Owner Type
Purchase Details
Closed on
Oct 20, 2021
Sold by
Schultz Richard A and Schultz Cynthia M
Bought by
Schultz Amy T
Current Estimated Value
Home Financials for this Owner
Home Financials are based on the most recent Mortgage that was taken out on this home.
Original Mortgage
$200,747
Outstanding Balance
$21,361
Interest Rate
2.8%
Mortgage Type
Future Advance Clause Open End Mortgage
Estimated Equity
$313,788
Purchase Details
Closed on
Sep 25, 2009
Sold by
Finnan Jerry
Bought by
Schultz Ricahrd
Home Financials for this Owner
Home Financials are based on the most recent Mortgage that was taken out on this home.
Original Mortgage
$206,250
Interest Rate
5.38%
Mortgage Type
New Conventional
Purchase Details
Closed on
Mar 6, 2009
Sold by
Schultz Richard A
Bought by
Finnan Jerry A
Purchase Details
Closed on
Mar 5, 2009
Sold by
Schultz Richard A
Bought by
Finnan Jerry A
Create a Home Valuation Report for This Property
The Home Valuation Report is an in-depth analysis detailing your home's value as well as a comparison with similar homes in the area
Home Values in the Area
Average Home Value in this Area
Purchase History
We collect this data history from publicly available records. To have your information removed, we recommend requesting removal directly through your county’s website.
| Date | Buyer | Sale Price | Title Company |
|---|---|---|---|
| Schultz Amy T | $250,000 | Greater Illinois Title | |
| Schultz Ricahrd | $273,500 | -- | |
| Finnan Jerry A | $274,000 | -- | |
| Finnan Jerry A | $274,000 | -- |
Source: Public Records
Mortgage History
We collect this data history from publicly available records. To have your information removed, we recommend requesting removal directly through your county’s website.
| Date | Status | Borrower | Loan Amount |
|---|---|---|---|
| Open | Schultz Amy T | $200,747 | |
| Previous Owner | Schultz Ricahrd | $206,250 |
Source: Public Records
Tax History
| Year | Tax Paid | Tax Assessment Tax Assessment Total Assessment is a certain percentage of the fair market value that is determined by local assessors to be the total taxable value of land and additions on the property. | Land | Improvement |
|---|---|---|---|---|
| 2025 | $7,309 | $100,468 | $19,529 | $80,939 |
| 2024 | $7,530 | $91,743 | $17,833 | $73,910 |
| 2023 | $7,380 | $79,992 | $15,549 | $64,443 |
| 2022 | $7,380 | $73,032 | $17,745 | $55,287 |
| 2021 | $7,580 | $68,497 | $16,643 | $51,854 |
| 2020 | $7,751 | $67,405 | $16,378 | $51,027 |
| 2019 | $7,599 | $64,756 | $15,734 | $49,022 |
| 2018 | $7,420 | $62,560 | $15,200 | $47,360 |
| 2017 | $7,490 | $60,136 | $14,611 | $45,525 |
| 2016 | $7,408 | $58,618 | $14,242 | $44,376 |
| 2015 | -- | $55,541 | $13,494 | $42,047 |
| 2014 | -- | $53,637 | $19,525 | $34,112 |
| 2013 | -- | $56,341 | $20,509 | $35,832 |
Source: Public Records
Map
Nearby Homes
- 1605 Mayflower Dr
- 181 Tilton Park Dr
- 1752 Tallmeadow Dr
- 821 N 5th St
- 804 N 4th St
- 804 N 5th St
- 649 Fox Hollow Ct
- 230 Augusta Ave
- 345 Augusta Ave
- 219 River Dr
- 231 River Dr
- 1173 Fox Hollow Ct
- 305 College Ave
- 730 Kimberly Dr
- 521 College Terrace
- 849 N 11th St
- 582 W Dresser Rd
- 223 W Locust St
- 533 College Ave
- 324 Birchwood Ln
- 216 Windsor Dr
- 204 Windsor Dr
- 1221 Sunnymeade Trail
- 207 Fairmont Dr
- 215 Fairmont Dr
- 201 Fairmont Dr
- 207 Windsor Dr
- 220 Windsor Dr
- 213 Windsor Dr
- 223 Fairmont Dr
- 201 Windsor Dr
- 219 Windsor Dr
- 1224 Sunnymeade Trail
- 1216 Sunnymeade Trail
- 202 Fairmont Dr
- 120 Windsor Dr
- 231 Fairmont Dr
- 208 Fairmont Dr
- 216 Fairmont Dr
- 226 Windsor Dr
Your Personal Tour Guide
Ask me questions while you tour the home.