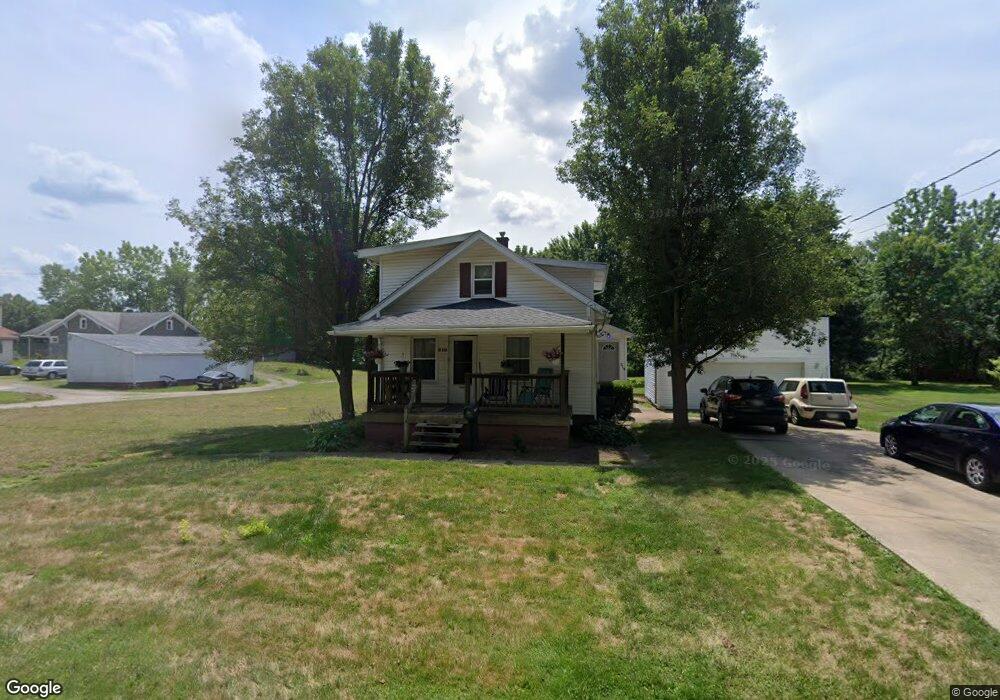
210 Woodard Ave Louisville, OH 44641
Estimated Value: $144,966 - $160,000
3
Beds
2
Baths
1,613
Sq Ft
$93/Sq Ft
Est. Value
About This Home
This home is located at 210 Woodard Ave, Louisville, OH 44641 and is currently estimated at $149,742, approximately $92 per square foot. 210 Woodard Ave is a home located in Stark County with nearby schools including Louisville High School and St. Thomas Aquinas High School & Middle School.
Ownership History
Date
Name
Owned For
Owner Type
Purchase Details
Closed on
Sep 8, 2021
Sold by
Mann Ronald L and Mann Angela R
Bought by
Mann Ronald L and Mann Angela R
Current Estimated Value
Purchase Details
Closed on
Dec 20, 2012
Sold by
The Secretatry Of Housing And Urban Deve
Bought by
Mann Ronld L
Purchase Details
Closed on
Jul 31, 2012
Sold by
Wells Fargo Bank Na
Bought by
Secretary Of Housing & Urban Development
Purchase Details
Closed on
Jun 25, 2012
Sold by
Kerr A Christine
Bought by
Wells Fargo Bank Na
Purchase Details
Closed on
Nov 19, 2007
Sold by
Starrr George D
Bought by
Kerr A Christine
Home Financials for this Owner
Home Financials are based on the most recent Mortgage that was taken out on this home.
Original Mortgage
$123,982
Interest Rate
6.45%
Mortgage Type
FHA
Create a Home Valuation Report for This Property
The Home Valuation Report is an in-depth analysis detailing your home's value as well as a comparison with similar homes in the area
Home Values in the Area
Average Home Value in this Area
Purchase History
| Date | Buyer | Sale Price | Title Company |
|---|---|---|---|
| Mann Ronald L | -- | None Available | |
| Mann Ronld L | $35,000 | None Available | |
| Secretary Of Housing & Urban Development | -- | None Available | |
| Wells Fargo Bank Na | $64,000 | None Available | |
| Kerr A Christine | $125,000 | Attorney |
Source: Public Records
Mortgage History
| Date | Status | Borrower | Loan Amount |
|---|---|---|---|
| Previous Owner | Kerr A Christine | $123,982 |
Source: Public Records
Tax History Compared to Growth
Tax History
| Year | Tax Paid | Tax Assessment Tax Assessment Total Assessment is a certain percentage of the fair market value that is determined by local assessors to be the total taxable value of land and additions on the property. | Land | Improvement |
|---|---|---|---|---|
| 2025 | -- | $35,880 | $14,460 | $21,420 |
| 2024 | -- | $35,880 | $14,460 | $21,420 |
| 2023 | $1,209 | $27,450 | $10,190 | $17,260 |
| 2022 | $1,214 | $27,450 | $10,190 | $17,260 |
| 2021 | $1,217 | $27,450 | $10,190 | $17,260 |
| 2020 | $1,037 | $25,310 | $8,890 | $16,420 |
| 2019 | $1,043 | $25,350 | $8,890 | $16,460 |
| 2018 | $1,040 | $25,350 | $8,890 | $16,460 |
| 2017 | $1,226 | $28,860 | $8,020 | $20,840 |
| 2016 | $1,251 | $28,860 | $8,020 | $20,840 |
| 2015 | $1,255 | $28,860 | $8,020 | $20,840 |
| 2014 | $1,305 | $27,900 | $7,770 | $20,130 |
| 2013 | $656 | $27,900 | $7,770 | $20,130 |
Source: Public Records
Map
Nearby Homes
- 300 Kennedy St
- 428 Honeycrisp Dr NE
- 3047 Mcintosh Dr NE
- 432 Honeycrisp Dr NE
- 2962 Mcintosh Dr NE
- 2963 Mcintosh Dr NE
- 430 Honeycrisp Dr NE
- 2957 Mcintosh Dr NE
- 325 Lincoln Ave
- 614 Reno Dr
- 316 E Reno Dr
- 524 Glenbar St
- 910 Crosswyck Cir
- 1170 Winding Ridge Ave
- 1149 Sturbridge Dr
- 1175 Sturbridge Dr
- 107 E Broad St
- 0 Glenbar St
- 5474 Ravenna Ave
- 204 E Broad St
- 212 Woodard Ave
- 302 Woodard Ave
- 203 Woodard Ave
- 312 Woodard Ave
- 803 N Chapel St
- 211 Woodard Ave
- 316Woodard Ave
- 807 N Chapel St
- 815 N Chapel St
- 215 Woodard Ave
- 309 Woodard Ave
- 315 Woodard Ave
- 404 Woodard Ave
- 733 N Chapel St
- 403 Woodard Ave
- 130 Frana Clara St
- 409 Woodard Ave
- 418 Woodward Ave
- 110 W Frana Clara St
- 150 Frana Clara St Unit 8