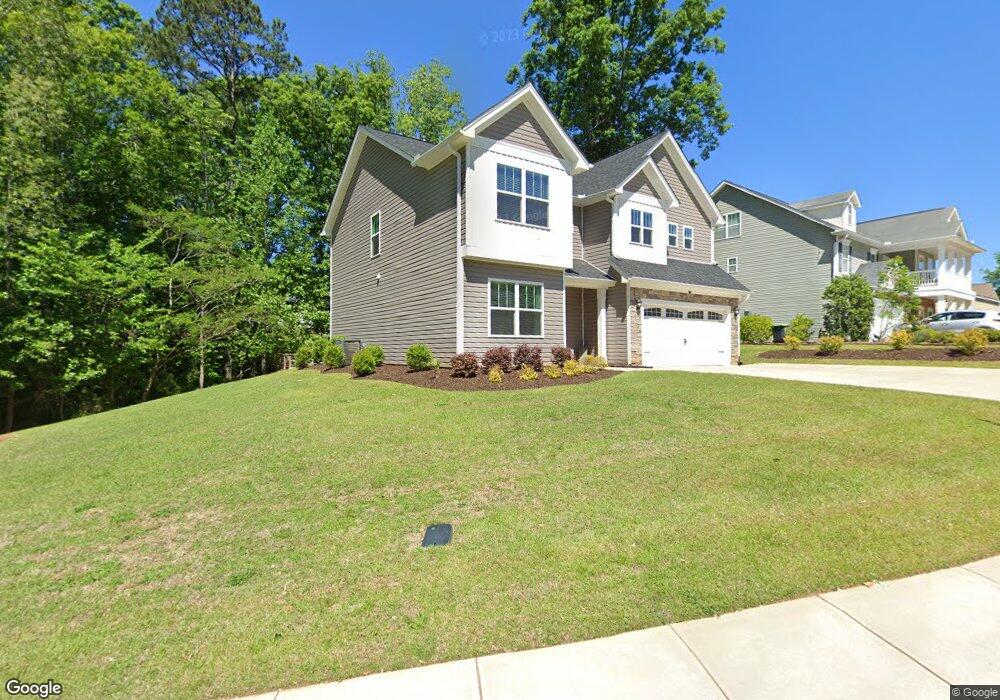
210 Woolbright Ln Chapin, SC 29036
Estimated Value: $392,000 - $434,000
5
Beds
3
Baths
2,533
Sq Ft
$162/Sq Ft
Est. Value
About This Home
This home is located at 210 Woolbright Ln, Chapin, SC 29036 and is currently estimated at $410,233, approximately $161 per square foot. 210 Woolbright Ln is a home located in Lexington County with nearby schools including Lake Murray Elementary School, Chapin Intermediate, and Chapin High School.
Ownership History
Date
Name
Owned For
Owner Type
Purchase Details
Closed on
Jul 10, 2023
Sold by
Cannon Madison M
Bought by
Hertler Kristin M
Current Estimated Value
Home Financials for this Owner
Home Financials are based on the most recent Mortgage that was taken out on this home.
Original Mortgage
$372,000
Outstanding Balance
$362,388
Interest Rate
6.79%
Mortgage Type
New Conventional
Estimated Equity
$47,845
Purchase Details
Closed on
Mar 12, 2021
Sold by
Conquest Homes Llc
Bought by
Cannon Madison M
Home Financials for this Owner
Home Financials are based on the most recent Mortgage that was taken out on this home.
Original Mortgage
$260,200
Interest Rate
2.7%
Mortgage Type
FHA
Create a Home Valuation Report for This Property
The Home Valuation Report is an in-depth analysis detailing your home's value as well as a comparison with similar homes in the area
Home Values in the Area
Average Home Value in this Area
Purchase History
| Date | Buyer | Sale Price | Title Company |
|---|---|---|---|
| Hertler Kristin M | $372,000 | None Listed On Document | |
| Cannon Madison M | $265,000 | None Available |
Source: Public Records
Mortgage History
| Date | Status | Borrower | Loan Amount |
|---|---|---|---|
| Open | Hertler Kristin M | $372,000 | |
| Previous Owner | Cannon Madison M | $260,200 |
Source: Public Records
Tax History
| Year | Tax Paid | Tax Assessment Tax Assessment Total Assessment is a certain percentage of the fair market value that is determined by local assessors to be the total taxable value of land and additions on the property. | Land | Improvement |
|---|---|---|---|---|
| 2024 | $2,383 | $22,320 | $2,550 | $19,770 |
| 2023 | $10,043 | $10,600 | $1,700 | $8,900 |
| 2020 | $1,214 | $2,550 | $2,550 | $0 |
| 2019 | $1,204 | $2,700 | $2,700 | $0 |
| 2018 | $221 | $522 | $522 | $0 |
| 2017 | $219 | $522 | $522 | $0 |
| 2016 | $217 | $522 | $522 | $0 |
| 2014 | $209 | $522 | $522 | $0 |
| 2013 | -- | $2,400 | $2,400 | $0 |
Source: Public Records
Map
Nearby Homes
- 208 Woolbright Ln
- 715 Soldier Gray Ln
- 315 Eagle Claw Dr
- 317 Eagle Claw Dr
- 0 Woodthrush Rd
- 0 Harvest View Rd
- 0 E Boundary St
- TBD Crooked Creek Rd
- 124 Peak St
- 0501 Crooked Creek Rd
- 120 W Horn Ct
- 115 Merowey Ct
- 118 Pacific Ave
- 100 Recluse St
- 125 Northshore Dr
- 132 Northshore Dr
- 562 Griffon Dr
- 14 Holliston Ct
- 570 Griffon Dr
- 578 Griffon Dr
- 403 Woolbright Ct
- 211 Woolbright Ln
- 206 Woolbright Ln
- 214 Woolbright Ln
- 213 Woolbright Ln
- 405 Woolbright Ct
- 217 Woolbright Ln
- 209 Woolbright Ln
- 0 Woolbright Ct
- 500 Varsity Ct
- 502 Varsity Ct
- 407 Woolbright Ct
- 205 Woolbright Ln
- 204 Woolbright Ln
- 219 Woolbright Ln
- 404 Woolbright Ln
- 203 Woolbright Ln
- 719 Soldier Gray Ln
- 409 Woolbright Ct
- 717 Soldier Gray Ln
Your Personal Tour Guide
Ask me questions while you tour the home.