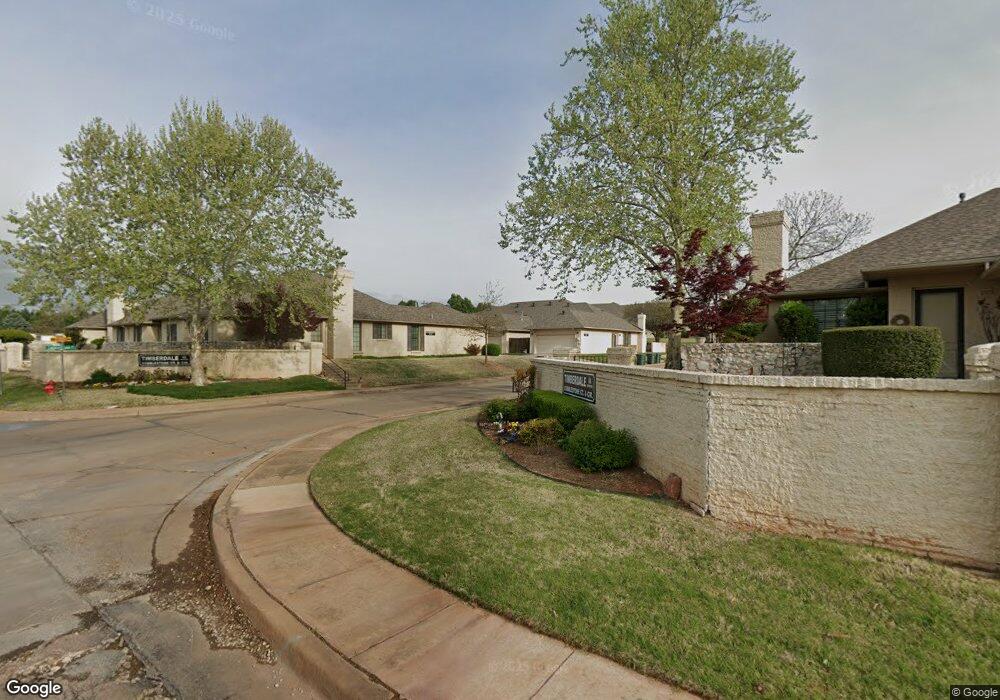
2100 Cobblestone Ct Unit 105 Edmond, OK 73034
Brookhaven North NeighborhoodEstimated Value: $194,363 - $215,000
2
Beds
2
Baths
1,548
Sq Ft
$132/Sq Ft
Est. Value
About This Home
This home is located at 2100 Cobblestone Ct Unit 105, Edmond, OK 73034 and is currently estimated at $204,591, approximately $132 per square foot. 2100 Cobblestone Ct Unit 105 is a home located in Oklahoma County with nearby schools including Northern Hills Elementary School, Sequoyah Middle School, and North High School.
Ownership History
Date
Name
Owned For
Owner Type
Purchase Details
Closed on
Sep 2, 2021
Sold by
Tommy Huelskamp Llc
Bought by
Nguyen Matthew Vuhuy and Nguyen Anh
Current Estimated Value
Home Financials for this Owner
Home Financials are based on the most recent Mortgage that was taken out on this home.
Original Mortgage
$359,920
Outstanding Balance
$327,012
Interest Rate
2.7%
Mortgage Type
New Conventional
Estimated Equity
-$122,421
Purchase Details
Closed on
Jul 13, 2021
Sold by
Premium Land Llc
Bought by
Tommy Huelskamp Llc
Home Financials for this Owner
Home Financials are based on the most recent Mortgage that was taken out on this home.
Original Mortgage
$359,920
Outstanding Balance
$327,012
Interest Rate
2.7%
Mortgage Type
New Conventional
Estimated Equity
-$122,421
Purchase Details
Closed on
Sep 23, 2020
Sold by
Tommy Huelskamp Llc
Bought by
Crowe Sean Patrick and Crowe Carrie Ann
Home Financials for this Owner
Home Financials are based on the most recent Mortgage that was taken out on this home.
Original Mortgage
$259,920
Interest Rate
2.9%
Mortgage Type
New Conventional
Purchase Details
Closed on
Jun 3, 2020
Sold by
Premium Land Llc
Bought by
Tommy Huelskamp Llc
Home Financials for this Owner
Home Financials are based on the most recent Mortgage that was taken out on this home.
Original Mortgage
$343,920
Interest Rate
3.3%
Mortgage Type
Construction
Purchase Details
Closed on
Feb 27, 2020
Sold by
Premium Land Llc
Bought by
Tommy Huelskamp Llc
Home Financials for this Owner
Home Financials are based on the most recent Mortgage that was taken out on this home.
Original Mortgage
$259,920
Interest Rate
3.6%
Mortgage Type
Construction
Purchase Details
Closed on
Apr 25, 2011
Sold by
Shaw Dorma Carter
Bought by
Farris Terry
Purchase Details
Closed on
May 18, 2009
Sold by
Shore Stanley D and Shore Pamela K
Bought by
Shore Stanley D and Shore Pamela K
Purchase Details
Closed on
Feb 5, 2009
Sold by
Snyder William E and Snyder Martha T
Bought by
Snyder William Edward and Snyder Martha Thorn
Purchase Details
Closed on
Nov 20, 1998
Sold by
Stegner Carol and Stegner Scott
Bought by
Shaw Dorma Carter
Purchase Details
Closed on
Nov 18, 1998
Sold by
Carter Kent and Carter Kelcie C
Bought by
Shaw Dorma Carter
Purchase Details
Closed on
Sep 25, 1998
Sold by
Patterson Pat K and Patterson Gayle Lea
Bought by
Shaw Dorma Carter and Carter Kent
Create a Home Valuation Report for This Property
The Home Valuation Report is an in-depth analysis detailing your home's value as well as a comparison with similar homes in the area
Home Values in the Area
Average Home Value in this Area
Purchase History
| Date | Buyer | Sale Price | Title Company |
|---|---|---|---|
| Nguyen Matthew Vuhuy | $450,000 | Oklahoma City Abstract & Ttl | |
| Tommy Huelskamp Llc | $68,000 | Oklahoma City Abstract & Ttl | |
| Crowe Sean Patrick | $325,000 | Chicago Title Oklahoma Co | |
| Tommy Huelskamp Llc | $68,000 | Oklahoma City Abstract & Tit | |
| Tommy Huelskamp Llc | $68,000 | Oklahoma City Abstract & Ttl | |
| Farris Terry | $155,000 | Stewart Abstract & Title Of | |
| Shore Stanley D | -- | None Available | |
| Snyder William Edward | -- | None Available | |
| Shaw Dorma Carter | -- | -- | |
| Shaw Dorma Carter | -- | -- | |
| Shaw Dorma Carter | -- | -- | |
| Shaw Dorma Carter | $101,000 | -- |
Source: Public Records
Mortgage History
| Date | Status | Borrower | Loan Amount |
|---|---|---|---|
| Open | Nguyen Matthew Vuhuy | $359,920 | |
| Previous Owner | Tommy Huelskamp Llc | $347,920 | |
| Previous Owner | Crowe Sean Patrick | $259,920 | |
| Previous Owner | Tommy Huelskamp Llc | $343,920 | |
| Previous Owner | Tommy Huelskamp Llc | $259,920 |
Source: Public Records
Tax History Compared to Growth
Tax History
| Year | Tax Paid | Tax Assessment Tax Assessment Total Assessment is a certain percentage of the fair market value that is determined by local assessors to be the total taxable value of land and additions on the property. | Land | Improvement |
|---|---|---|---|---|
| 2024 | $1,892 | $19,057 | $2,445 | $16,612 |
| 2023 | $1,892 | $18,150 | $2,893 | $15,257 |
| 2022 | $1,891 | $18,069 | $2,872 | $15,197 |
| 2021 | $1,792 | $17,209 | $2,883 | $14,326 |
| 2020 | $1,728 | $16,390 | $2,634 | $13,756 |
| 2019 | $1,683 | $15,895 | $2,634 | $13,261 |
| 2018 | $1,635 | $15,345 | $0 | $0 |
| 2017 | $1,569 | $14,794 | $2,634 | $12,160 |
| 2016 | $1,536 | $14,514 | $2,580 | $11,934 |
| 2015 | $1,535 | $14,518 | $2,580 | $11,938 |
| 2014 | $1,625 | $15,393 | $2,580 | $12,813 |
Source: Public Records
Map
Nearby Homes
- 249 Cobblestone Cir
- 404 Timber Ridge Rd
- 503 Hunters Ct
- 1713 Timber Ridge Rd
- 611 Sunny Brook Dr
- 2026 Appalachian Trail
- 709 Timber Ridge Dr
- 422 Oregon Trail
- 326 Bozeman Trail
- 2500 Hidden Hollow Dr
- 405 Bright Angel Trail
- 2301 Brookside Ave
- 2802 Coldbrook Ln
- 2901 Stonebrook Rd
- 2401 Brookdale Ave
- 117 Stonebrook Way
- 1804 Saint Christopher Dr
- 1016 Olde Bridge Rd
- 2501 Valley Brook Dr
- 308 Clermont Dr
- 2100 Cobblestone Ct Unit 119
- 2100 Cobblestone Ct Unit 118
- 2100 Cobblestone Ct Unit 120
- 2100 Cobblestone Ct Unit 117
- 2100 Cobblestone Ct Unit 116
- 2100 Cobblestone Ct Unit 115
- 2100 Cobblestone Ct Unit 114
- 2100 Cobblestone Ct Unit 113
- 2100 Cobblestone Ct Unit 112
- 2100 Cobblestone Ct Unit 111
- 2100 Cobblestone Ct Unit 110
- 2100 Cobblestone Ct Unit 109
- 2100 Cobblestone Ct Unit 108
- 2100 Cobblestone Ct Unit 107
- 2100 Cobblestone Ct Unit 106
- 2100 Cobblestone Ct Unit 104
- 2100 Cobblestone Ct Unit 102
- 2100 Cobblestone Ct #101 Unit 101
- 2201 Cobblestone Ct
- 204 Timberdale Terrace