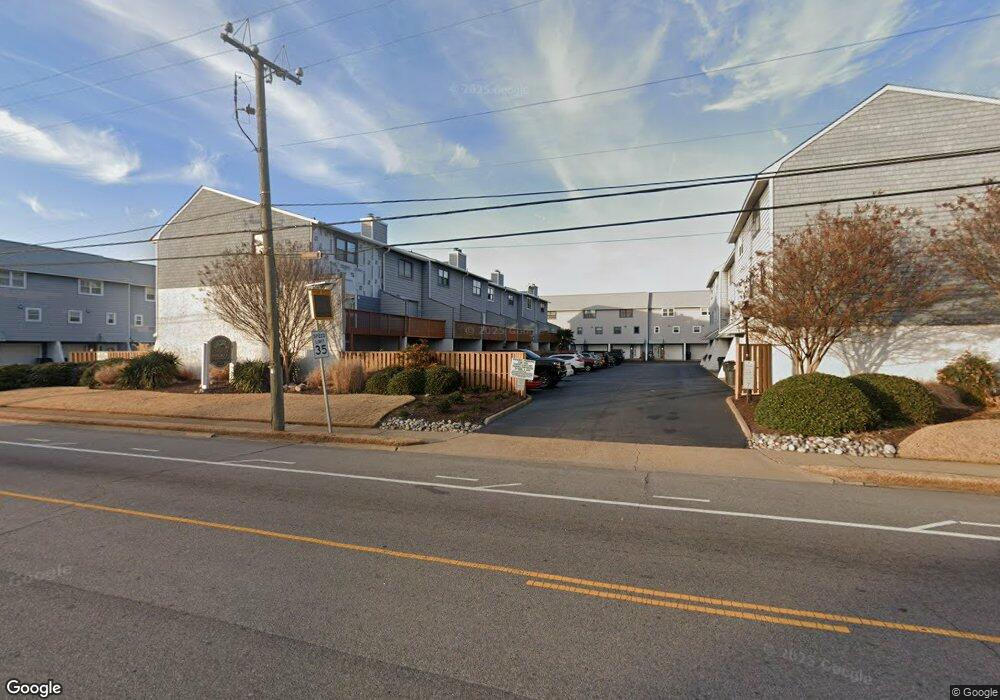
2100 E Ocean View Ave Unit 41 Norfolk, VA 23518
East Ocean View NeighborhoodEstimated Value: $384,000 - $419,000
3
Beds
3
Baths
2,038
Sq Ft
$197/Sq Ft
Est. Value
About This Home
This home is located at 2100 E Ocean View Ave Unit 41, Norfolk, VA 23518 and is currently estimated at $401,584, approximately $197 per square foot. 2100 E Ocean View Ave Unit 41 is a home located in Norfolk City with nearby schools including Little Creek Elementary School, Azalea Gardens Middle School, and Lake Taylor High School.
Ownership History
Date
Name
Owned For
Owner Type
Purchase Details
Closed on
Oct 4, 2016
Sold by
Mariluch Derrick J
Bought by
Conner Ellen
Current Estimated Value
Home Financials for this Owner
Home Financials are based on the most recent Mortgage that was taken out on this home.
Original Mortgage
$160,800
Outstanding Balance
$128,830
Interest Rate
3.44%
Mortgage Type
New Conventional
Estimated Equity
$272,755
Purchase Details
Closed on
Jun 6, 2012
Sold by
Fannie Mae
Bought by
Mariluch Derrick J
Home Financials for this Owner
Home Financials are based on the most recent Mortgage that was taken out on this home.
Original Mortgage
$102,000
Interest Rate
3.37%
Mortgage Type
New Conventional
Purchase Details
Closed on
Mar 13, 2012
Sold by
Hickman Michael R
Bought by
Federal National Mortgage Association
Create a Home Valuation Report for This Property
The Home Valuation Report is an in-depth analysis detailing your home's value as well as a comparison with similar homes in the area
Home Values in the Area
Average Home Value in this Area
Purchase History
| Date | Buyer | Sale Price | Title Company |
|---|---|---|---|
| Conner Ellen | $201,000 | Advance Title & Abstract Inc | |
| Mariluch Derrick J | $137,500 | None Available | |
| Federal National Mortgage Association | $191,588 | Colonial Title & Abstracting |
Source: Public Records
Mortgage History
| Date | Status | Borrower | Loan Amount |
|---|---|---|---|
| Open | Conner Ellen | $160,800 | |
| Previous Owner | Mariluch Derrick J | $102,000 |
Source: Public Records
Tax History
| Year | Tax Paid | Tax Assessment Tax Assessment Total Assessment is a certain percentage of the fair market value that is determined by local assessors to be the total taxable value of land and additions on the property. | Land | Improvement |
|---|---|---|---|---|
| 2025 | $4,739 | $379,100 | $78,900 | $300,200 |
| 2024 | $4,253 | $345,800 | $78,900 | $266,900 |
| 2023 | $3,986 | $318,900 | $78,900 | $240,000 |
| 2022 | $3,574 | $285,900 | $66,400 | $219,500 |
| 2021 | $2,734 | $218,700 | $61,000 | $157,700 |
| 2020 | $2,666 | $213,300 | $55,600 | $157,700 |
| 2019 | $2,666 | $213,300 | $55,600 | $157,700 |
| 2018 | $2,529 | $202,300 | $55,600 | $146,700 |
| 2017 | $2,337 | $203,200 | $63,200 | $140,000 |
| 2016 | $2,337 | $221,500 | $62,900 | $158,600 |
| 2015 | $2,515 | $221,500 | $62,900 | $158,600 |
| 2014 | $2,515 | $221,500 | $62,900 | $158,600 |
Source: Public Records
Map
Nearby Homes
- 2100 E Ocean View Ave Unit 22
- 2100 E Ocean View Ave Unit 30
- 2246 E Ocean View Ave Unit 203
- 9600 2nd Bay St Unit 102
- 9600 2nd Bay St Unit 103
- 9600 2nd Bay St Unit 101
- 9600 2nd Bay St Unit 201
- 9600 2nd Bay St Unit 203
- 9600 2nd Bay St Unit 202
- 9600 2nd Bay St Unit 104
- 9518 3rd Bay St Unit 112
- 2009 Parkview Ave
- 1933 E Ocean View Ave
- 1923 E Ocean View Ave
- 9609 9th Bay St
- 1937 Edgewood Ave
- 9524 8th Bay St
- 2917 Pretty Lake Ave
- 2919 Pretty Lake Ave
- 2921 Pretty Lake Ave
- 2100 E Ocean View Ave Unit 28
- 2100 Ocean View Ave E #2
- 2100 E Ocean View Ave Unit Ebb tide
- 2100 E Ocean View Ave Unit 21
- 2100 E Ocean View Ave Unit 16
- 2100 E Ocean View Ave Unit 10
- 2100 E Ocean View Ave Unit 6
- 2100 E Ocean View Ave Unit 17
- 2100 E Ocean View Ave Unit 32
- 2100 E Ocean View Ave Unit 2
- 2100 E Ocean View Ave Unit 9
- 2100 E Ocean View Ave Unit 34
- 2100 E Ocean View Ave Unit 8
- 2100 E Ocean View Ave Unit 29
- 2100 E Ocean View Ave Unit 5
- 2100 E Ocean View Ave Unit 39
- 2100 E Ocean View Ave Unit 11
- 2100 E Ocean View Ave Unit 2
- 2100 E Ocean View Ave Unit 12
- 2100 E Ocean View Ave Unit 40
Your Personal Tour Guide
Ask me questions while you tour the home.