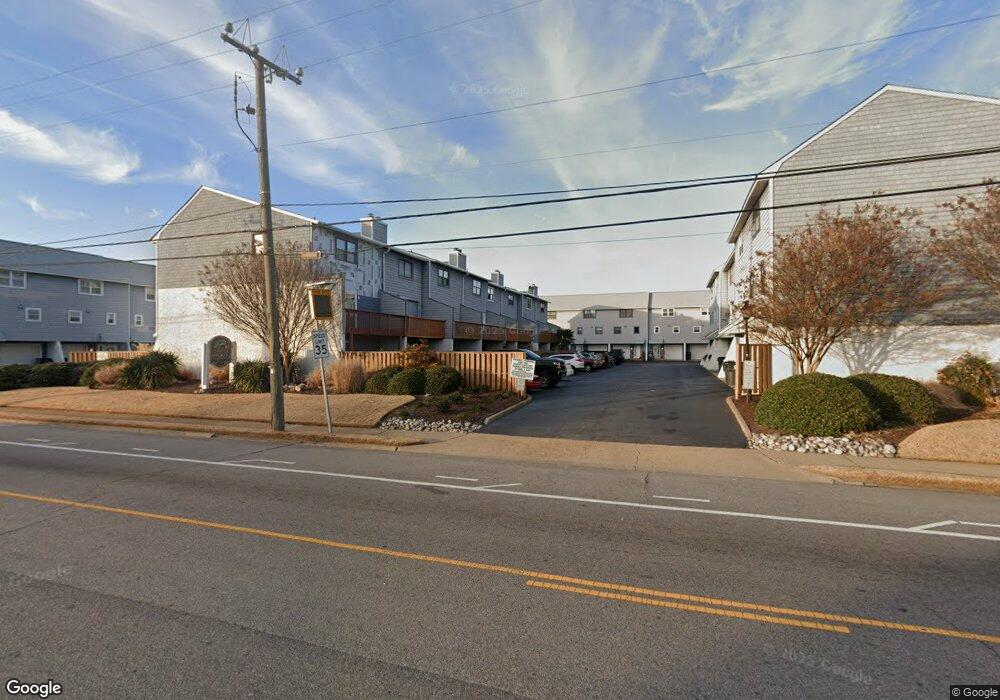
2100 E Ocean View Ave Unit 9 Norfolk, VA 23518
East Ocean View NeighborhoodEstimated Value: $414,000 - $433,000
3
Beds
3
Baths
1,794
Sq Ft
$235/Sq Ft
Est. Value
About This Home
This home is located at 2100 E Ocean View Ave Unit 9, Norfolk, VA 23518 and is currently estimated at $421,409, approximately $234 per square foot. 2100 E Ocean View Ave Unit 9 is a home located in Norfolk City with nearby schools including Little Creek Elementary School, Azalea Gardens Middle School, and Lake Taylor High School.
Ownership History
Date
Name
Owned For
Owner Type
Purchase Details
Closed on
Mar 20, 2024
Sold by
Johnson Malcolm Ahmad and Johnson Amanda
Bought by
Meacham Jacob R and Barlow Sarah V
Current Estimated Value
Home Financials for this Owner
Home Financials are based on the most recent Mortgage that was taken out on this home.
Original Mortgage
$313,600
Outstanding Balance
$308,520
Interest Rate
6.77%
Mortgage Type
New Conventional
Estimated Equity
$112,889
Purchase Details
Closed on
Jul 8, 2019
Sold by
The Last Will And Testament Of Carol Ann
Bought by
Johnson Malcolm Ahmad and Johnson Amanda
Home Financials for this Owner
Home Financials are based on the most recent Mortgage that was taken out on this home.
Original Mortgage
$226,773
Interest Rate
3.9%
Mortgage Type
VA
Create a Home Valuation Report for This Property
The Home Valuation Report is an in-depth analysis detailing your home's value as well as a comparison with similar homes in the area
Home Values in the Area
Average Home Value in this Area
Purchase History
We collect this data history from publicly available records. To have your information removed, we recommend requesting removal directly through your county’s website.
| Date | Buyer | Sale Price | Title Company |
|---|---|---|---|
| Meacham Jacob R | $392,000 | Fidelity National Title | |
| Johnson Malcolm Ahmad | $222,000 | Viking Title & Escrow Llc |
Source: Public Records
Mortgage History
We collect this data history from publicly available records. To have your information removed, we recommend requesting removal directly through your county’s website.
| Date | Status | Borrower | Loan Amount |
|---|---|---|---|
| Open | Meacham Jacob R | $313,600 | |
| Previous Owner | Johnson Malcolm Ahmad | $226,773 |
Source: Public Records
Tax History
| Year | Tax Paid | Tax Assessment Tax Assessment Total Assessment is a certain percentage of the fair market value that is determined by local assessors to be the total taxable value of land and additions on the property. | Land | Improvement |
|---|---|---|---|---|
| 2025 | $4,673 | $379,900 | $78,900 | $301,000 |
| 2024 | $4,218 | $342,900 | $78,900 | $264,000 |
| 2023 | $3,954 | $316,300 | $78,900 | $237,400 |
| 2022 | $3,544 | $283,500 | $66,400 | $217,100 |
| 2021 | $2,816 | $225,300 | $61,000 | $164,300 |
| 2020 | $2,749 | $219,900 | $55,600 | $164,300 |
| 2019 | $2,645 | $211,600 | $55,600 | $156,000 |
| 2018 | $2,509 | $200,700 | $55,600 | $145,100 |
| 2017 | $2,337 | $203,200 | $63,200 | $140,000 |
| 2016 | $2,337 | $221,500 | $62,900 | $158,600 |
| 2015 | $2,494 | $221,500 | $62,900 | $158,600 |
| 2014 | $2,494 | $221,500 | $62,900 | $158,600 |
Source: Public Records
Map
Nearby Homes
- 2100 E Ocean View Ave Unit 22
- 2080 E Ocean View Ave Unit 1B
- 9600 2nd Bay St Unit 103
- 9600 2nd Bay St Unit 104
- 9600 2nd Bay St Unit 102
- 9607 Whit Ave
- 2004 E Ocean View Ave
- 2317 Pretty Lake Ave
- 9518 3rd Bay St Unit 117
- 9518 3rd Bay St Unit 112
- 2009 Parkview Ave
- 9601 Inlet Rd
- 9532 5th Bay St Unit C
- 9716 7th Bay St Unit 201
- 9569 7th Bay St Unit A
- 1912 E Ocean View Ave Unit A
- 9513 6th Bay St
- 9609 8th Bay St
- 9577 8th Bay St Unit 9577
- 9512 7th Bay St
- 2100 E Ocean View Ave Unit 28
- 2100 Ocean View Ave E #2
- 2100 E Ocean View Ave Unit Ebb tide
- 2100 E Ocean View Ave Unit 21
- 2100 E Ocean View Ave Unit 16
- 2100 E Ocean View Ave Unit 10
- 2100 E Ocean View Ave Unit 6
- 2100 E Ocean View Ave Unit 17
- 2100 E Ocean View Ave Unit 32
- 2100 E Ocean View Ave Unit 2
- 2100 E Ocean View Ave Unit 34
- 2100 E Ocean View Ave Unit 8
- 2100 E Ocean View Ave Unit 29
- 2100 E Ocean View Ave Unit 5
- 2100 E Ocean View Ave Unit 39
- 2100 E Ocean View Ave Unit 11
- 2100 E Ocean View Ave Unit 2
- 2100 E Ocean View Ave Unit 12
- 2100 E Ocean View Ave Unit 41
- 2100 E Ocean View Ave Unit 40
Your Personal Tour Guide
Ask me questions while you tour the home.