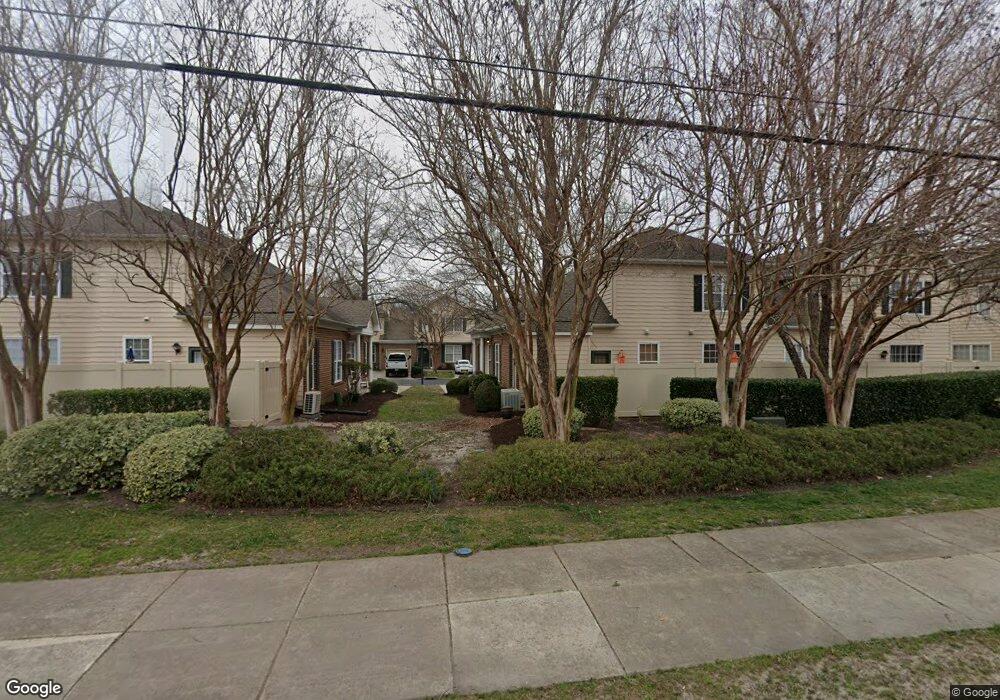
2100 Exmoor Ct Unit 2100 Virginia Beach, VA 23464
Estimated Value: $359,964 - $380,000
3
Beds
3
Baths
1,819
Sq Ft
$202/Sq Ft
Est. Value
About This Home
This home is located at 2100 Exmoor Ct Unit 2100, Virginia Beach, VA 23464 and is currently estimated at $367,991, approximately $202 per square foot. 2100 Exmoor Ct Unit 2100 is a home located in Virginia Beach City with nearby schools including Tallwood Elementary School, Brandon Middle School, and Tallwood High School.
Ownership History
Date
Name
Owned For
Owner Type
Purchase Details
Closed on
Jan 22, 2025
Sold by
Parks Brett
Bought by
Alexander Liam Theodore
Current Estimated Value
Home Financials for this Owner
Home Financials are based on the most recent Mortgage that was taken out on this home.
Original Mortgage
$365,186
Outstanding Balance
$362,606
Interest Rate
6.72%
Mortgage Type
VA
Estimated Equity
$5,385
Purchase Details
Closed on
Jul 22, 2020
Sold by
Salamone Ruth Patricia
Bought by
Salamane Robert Joseph
Purchase Details
Closed on
Apr 16, 2004
Sold by
Dragas Assocs Viii
Bought by
Glaspie Richard
Home Financials for this Owner
Home Financials are based on the most recent Mortgage that was taken out on this home.
Original Mortgage
$197,600
Interest Rate
5.4%
Mortgage Type
New Conventional
Create a Home Valuation Report for This Property
The Home Valuation Report is an in-depth analysis detailing your home's value as well as a comparison with similar homes in the area
Home Values in the Area
Average Home Value in this Area
Purchase History
| Date | Buyer | Sale Price | Title Company |
|---|---|---|---|
| Alexander Liam Theodore | $357,500 | Priority Title | |
| Salamane Robert Joseph | -- | First American Title Ins | |
| Glaspie Richard | $247,350 | -- |
Source: Public Records
Mortgage History
| Date | Status | Borrower | Loan Amount |
|---|---|---|---|
| Open | Alexander Liam Theodore | $365,186 | |
| Previous Owner | Glaspie Richard | $197,600 |
Source: Public Records
Tax History Compared to Growth
Tax History
| Year | Tax Paid | Tax Assessment Tax Assessment Total Assessment is a certain percentage of the fair market value that is determined by local assessors to be the total taxable value of land and additions on the property. | Land | Improvement |
|---|---|---|---|---|
| 2025 | $3,221 | $353,300 | $105,000 | $248,300 |
| 2024 | $3,221 | $332,100 | $105,000 | $227,100 |
| 2023 | $3,090 | $312,100 | $85,000 | $227,100 |
| 2022 | $2,728 | $275,600 | $63,000 | $212,600 |
| 2021 | $2,401 | $242,500 | $63,000 | $179,500 |
| 2020 | $2,459 | $241,700 | $60,000 | $181,700 |
| 2019 | $2,304 | $224,400 | $58,000 | $166,400 |
| 2018 | $2,250 | $224,400 | $58,000 | $166,400 |
| 2017 | $2,251 | $224,500 | $58,000 | $166,500 |
| 2016 | $2,153 | $217,500 | $72,100 | $145,400 |
| 2015 | $2,190 | $221,200 | $74,200 | $147,000 |
| 2014 | $2,020 | $214,000 | $67,200 | $146,800 |
Source: Public Records
Map
Nearby Homes
- 5939 Ludington Dr
- 5685 Glen View Dr
- 2104 Pateshall Ct
- 2205 Fort Belvoir Dr
- 5800 Baynebridge Dr
- 1500 Blade Ct
- 1345 Simon Dr
- 1534 Carrolton Way
- 5928 Chain Bridge Rd
- 1832 Monument Dr
- 1541 Orchard Grove Dr
- 1439 Thistlewood Ln
- 1441 Carrolton Way Unit 165
- 1443 Thistlewood Ln
- 1439 Blairwood Ln
- 1439 Orchard Grove Dr
- 1873 Kempsville Crossing Ln
- 1468 Otterbourne Cir
- MM Sycamore
- MM Dogwood
- 2104 Exmoor Ct
- 2108 Exmoor Ct
- 2169 Tarleton Oaks Dr
- 2165 Tarleton Oaks Dr
- 5816 Echingham Dr
- 2112 Exmoor Ct
- 2116 Exmoor Ct
- 5808 Echingham Dr
- 5825 Echingham Dr
- 5812 Echingham Dr
- 2161 Tarleton Oaks Dr
- 5804 Echingham Dr
- 2157 Tarleton Oaks Dr
- 5800 Echingham Dr
- 5820 Echingham Dr
- 5829 Echingham Dr
- 2153 Tarleton Oaks Dr
- 2113 Exmoor Ct
- 5833 Echingham Dr
- 5837 Echingham Dr