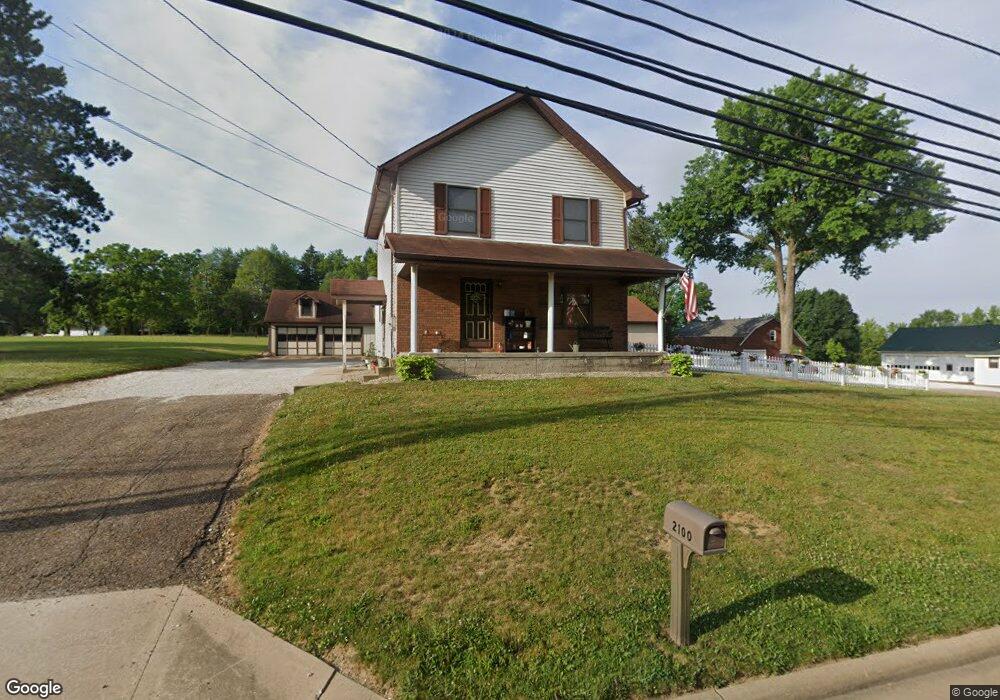
2100 Faircrest St SW Canton, OH 44706
Estimated Value: $156,817 - $246,000
3
Beds
2
Baths
1,325
Sq Ft
$158/Sq Ft
Est. Value
About This Home
This home is located at 2100 Faircrest St SW, Canton, OH 44706 and is currently estimated at $209,704, approximately $158 per square foot. 2100 Faircrest St SW is a home located in Stark County with nearby schools including Faircrest Memorial Elementary School, Canton South High School, and Beacon Academy.
Ownership History
Date
Name
Owned For
Owner Type
Purchase Details
Closed on
Dec 2, 2020
Sold by
Hein Penny H
Bought by
Hein Brian T
Current Estimated Value
Purchase Details
Closed on
Dec 15, 2018
Sold by
Estate Of Carl Hein
Bought by
Hein Penny H
Purchase Details
Closed on
Dec 12, 2016
Sold by
J C Hein Real Estate Co Llc
Bought by
Hein Carl
Purchase Details
Closed on
Mar 20, 2006
Sold by
J C Real Estate Partnership
Bought by
J C Hein Real Estate Co Llc
Purchase Details
Closed on
Oct 29, 2001
Sold by
Weston David A
Bought by
Hein Brian T and Hein Theresa A
Purchase Details
Closed on
May 26, 1995
Sold by
Hein Randy L
Bought by
J C Real Estate Ptns
Home Financials for this Owner
Home Financials are based on the most recent Mortgage that was taken out on this home.
Original Mortgage
$56,000
Interest Rate
8.4%
Mortgage Type
New Conventional
Create a Home Valuation Report for This Property
The Home Valuation Report is an in-depth analysis detailing your home's value as well as a comparison with similar homes in the area
Home Values in the Area
Average Home Value in this Area
Purchase History
| Date | Buyer | Sale Price | Title Company |
|---|---|---|---|
| Hein Brian T | -- | None Available | |
| Hein Penny H | -- | None Available | |
| Hein Carl | -- | None Available | |
| J C Hein Real Estate Co Llc | -- | None Available | |
| Hein Brian T | $77,000 | -- | |
| J C Real Estate Ptns | $76,000 | -- |
Source: Public Records
Mortgage History
| Date | Status | Borrower | Loan Amount |
|---|---|---|---|
| Previous Owner | J C Real Estate Ptns | $56,000 |
Source: Public Records
Tax History Compared to Growth
Tax History
| Year | Tax Paid | Tax Assessment Tax Assessment Total Assessment is a certain percentage of the fair market value that is determined by local assessors to be the total taxable value of land and additions on the property. | Land | Improvement |
|---|---|---|---|---|
| 2025 | -- | $31,710 | $2,310 | $29,400 |
| 2024 | -- | $31,710 | $2,310 | $29,400 |
| 2023 | $1,033 | $22,890 | $2,240 | $20,650 |
| 2022 | $960 | $22,890 | $2,240 | $20,650 |
| 2021 | $964 | $22,890 | $2,240 | $20,650 |
| 2020 | $942 | $19,190 | $1,930 | $17,260 |
| 2019 | $950 | $19,190 | $1,930 | $17,260 |
| 2018 | $949 | $19,190 | $1,930 | $17,260 |
| 2017 | $903 | $17,230 | $1,790 | $15,440 |
| 2016 | $904 | $17,230 | $1,790 | $15,440 |
| 2015 | $1,134 | $21,600 | $1,790 | $19,810 |
| 2014 | $1,049 | $18,760 | $1,540 | $17,220 |
| 2013 | $529 | $18,760 | $1,540 | $17,220 |
Source: Public Records
Map
Nearby Homes
- 4314 Millport Ave SW
- 1521 Bravado Rd SW
- 1550 Rebel St SW
- 3223 Dueber Ave SW
- 3245 Sierra Ave SW
- 3641 Diane Ave SW
- 3673 Highview Ave SW
- 223 Faircrest St SW
- 236 32nd St SW
- 3415 Cleveland Ave SW
- 2802 Rexdale St SW
- 900 53rd St SW
- 3939 Cleveland Ave SW
- 3463 Shepler Church Ave SW
- 5226 Ashmont Ave SW
- 0 Sherman Church Ave SW
- 4624 Ridge Ave SE
- 340 53rd St SW
- 3903 Richville Dr SW
- 5434 Briggle Ave SW
- 2107 Faircrest St SW
- 2202 Faircrest St SW
- 2005 Faircrest St SW
- 2216 Faircrest St SW
- 4065 Dueber Ave SW
- 4101 Dueber Ave SW
- 4111 Dueber Ave SW
- 4055 Dueber Ave SW
- 4055 Dueber Ave SW
- 4131 Dueber Ave SW
- 4060 Dueber Ave SW
- 2234 Faircrest St SW
- 4201 Dueber Ave SW
- 4035 Dueber Ave SW
- 4215 Dueber Ave SW
- 4219 Dueber Ave SW
- 4122 Dueber Ave SW
- 4030 Dueber Ave SW
- 4130 Dueber Ave SW
- 4136 Dueber Ave SW