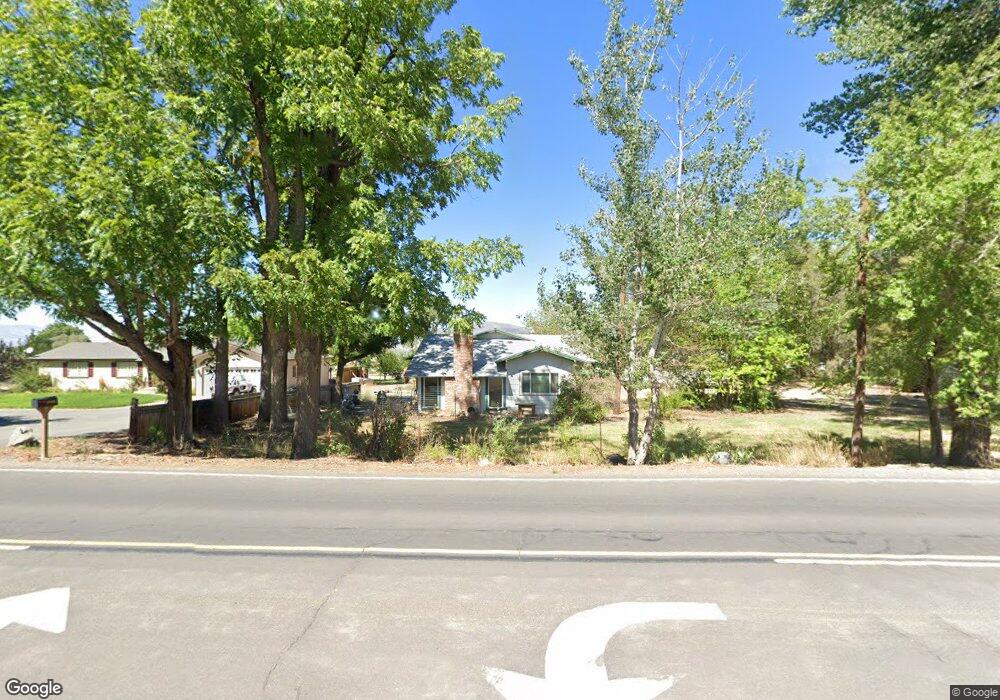
2100 Farm District Rd Fernley, NV 89408
Estimated Value: $314,000 - $392,000
3
Beds
1
Bath
1,397
Sq Ft
$264/Sq Ft
Est. Value
About This Home
This home is located at 2100 Farm District Rd, Fernley, NV 89408 and is currently estimated at $368,436, approximately $263 per square foot. 2100 Farm District Rd is a home located in Lyon County with nearby schools including East Valley Elementary School, Fernley Intermediate School, and Fernley High School.
Ownership History
Date
Name
Owned For
Owner Type
Purchase Details
Closed on
Dec 21, 2011
Sold by
Challacomb David and Challacomb Katherine
Bought by
Challacomb Katharine S and Challacomb David G
Current Estimated Value
Create a Home Valuation Report for This Property
The Home Valuation Report is an in-depth analysis detailing your home's value as well as a comparison with similar homes in the area
Home Values in the Area
Average Home Value in this Area
Purchase History
| Date | Buyer | Sale Price | Title Company |
|---|---|---|---|
| Challacomb Katharine S | -- | None Available |
Source: Public Records
Tax History Compared to Growth
Tax History
| Year | Tax Paid | Tax Assessment Tax Assessment Total Assessment is a certain percentage of the fair market value that is determined by local assessors to be the total taxable value of land and additions on the property. | Land | Improvement |
|---|---|---|---|---|
| 2025 | $2,342 | $45,920 | $26,250 | $19,670 |
| 2024 | $2,226 | $45,710 | $26,250 | $19,460 |
| 2023 | $2,226 | $44,016 | $26,250 | $17,766 |
| 2022 | $1,923 | $42,456 | $26,250 | $16,206 |
| 2021 | $1,833 | $41,751 | $26,250 | $15,501 |
| 2020 | $1,747 | $40,777 | $26,250 | $14,527 |
| 2019 | $1,581 | $27,400 | $13,650 | $13,750 |
| 2018 | $1,524 | $26,765 | $13,650 | $13,115 |
| 2017 | $1,494 | $33,904 | $21,000 | $12,904 |
| 2016 | $1,471 | $24,382 | $13,650 | $10,732 |
| 2015 | $1,469 | $25,260 | $13,650 | $11,610 |
| 2014 | $1,454 | $23,445 | $13,650 | $9,795 |
Source: Public Records
Map
Nearby Homes
- 1194 Jasmine Ln
- 1187 Jasmine Ln
- 0 Nevada Pacific Blvd
- 1075 Browne Ln
- APN 021-191-08
- 021 46103
- 1315 Winnies Ln
- 1324 Nevada Pacific Blvd
- 1371 Nevada Pacific Blvd
- 1369 Nevada Pacific Blvd
- 4555 Mifflin St
- 4555 Mifflin St Unit Lot 22
- 4552 Mifflin St
- 4552 Mifflin St Unit Lot 9
- 4547 Mifflin St Unit Lot 24
- 1353 Winnies Ln
- 4535 Mifflin St
- 4536 Mifflin St Unit Lot 5
- 4531 Mifflin St Unit Lot 28
- 4531 Mifflin St
- 2090 Farm District Rd
- 2150 Farm District Rd
- 1296 Rainbow Ln
- 1294 Rainbow Ln
- 1292 Rainbow Ln
- 1290 Rainbow Ln
- 1280 Browne Ln
- 1260 Browne Ln
- 1288 Rainbow Ln
- 1240 Browne Ln
- 1220 Browne Ln
- 1286 Rainbow Ln
- 1352 Nevada Pacific Blvd
- 1352 Nevada Pacific Blvd
- 1284 Rainbow Ln
- 1351 Nevada Pacific Blvd
- 1351 Nevada Pacific Blvd Unit 10
- 2251 Hayfield Ln
- 1345 Sunflower Ln