Estimated Value: $154,000 - $181,000
--
Bed
--
Bath
1,148
Sq Ft
$143/Sq Ft
Est. Value
About This Home
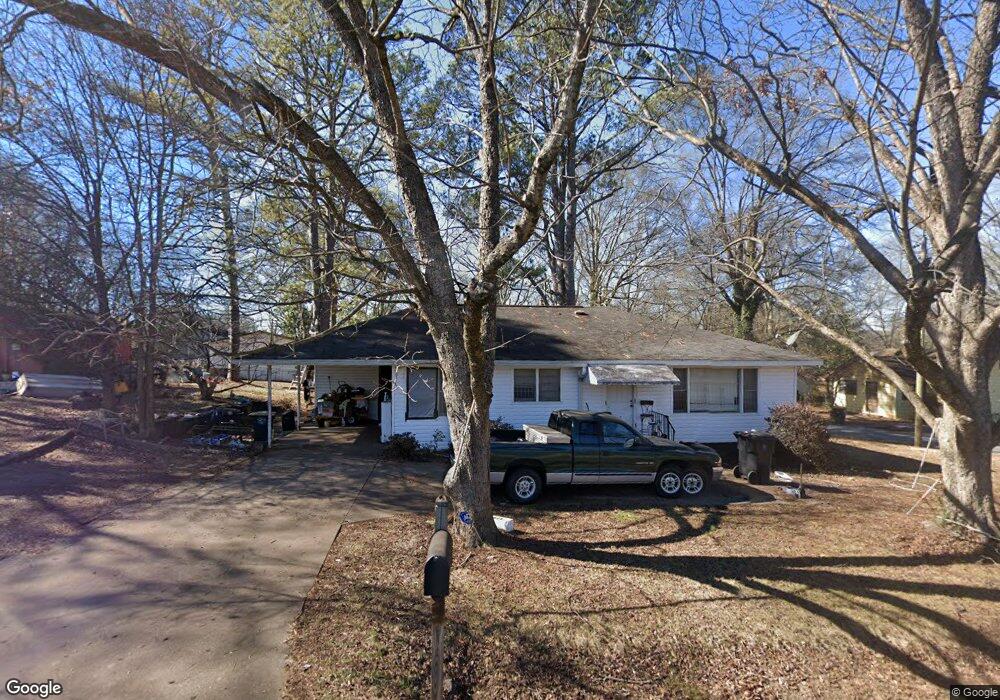
This home is located at 2100 Flannery St SW, Rome, GA 30161 and is currently estimated at $163,785, approximately $142 per square foot. 2100 Flannery St SW is a home located in Floyd County with nearby schools including Dan McCarty Middle School, Rome High School, and Darlington School.
Ownership History
Date
Name
Owned For
Owner Type
Purchase Details
Closed on
Oct 13, 2009
Sold by
Price James R
Bought by
Garrett Joe L
Current Estimated Value
Home Financials for this Owner
Home Financials are based on the most recent Mortgage that was taken out on this home.
Original Mortgage
$75,193
Outstanding Balance
$49,000
Interest Rate
5.04%
Mortgage Type
FHA
Estimated Equity
$114,785
Purchase Details
Closed on
Feb 16, 2007
Sold by
Not Provided
Bought by
Garrett Joe L
Purchase Details
Closed on
May 23, 2003
Sold by
Price Mildred
Bought by
Price Mildred
Purchase Details
Closed on
May 21, 2003
Sold by
Bowman Ruby M
Bought by
Price Mildred
Purchase Details
Closed on
Aug 2, 1984
Sold by
Barnes Odessa Thacker
Bought by
Bowman Ruby M
Purchase Details
Closed on
Jan 1, 1973
Sold by
Barnes T A
Bought by
Barnes Odessa Thacker
Purchase Details
Closed on
Jan 1, 1901
Bought by
Barnes T A
Create a Home Valuation Report for This Property
The Home Valuation Report is an in-depth analysis detailing your home's value as well as a comparison with similar homes in the area
Home Values in the Area
Average Home Value in this Area
Purchase History
| Date | Buyer | Sale Price | Title Company |
|---|---|---|---|
| Garrett Joe L | $79,900 | -- | |
| Garrett Joe L | -- | -- | |
| Price Mildred | -- | -- | |
| Price Mildred | -- | -- | |
| Bowman Ruby M | $27,000 | -- | |
| Barnes Odessa Thacker | -- | -- | |
| Barnes T A | -- | -- |
Source: Public Records
Mortgage History
| Date | Status | Borrower | Loan Amount |
|---|---|---|---|
| Open | Garrett Joe L | $75,193 | |
| Closed | Garrett Joe L | $6,000 |
Source: Public Records
Tax History Compared to Growth
Tax History
| Year | Tax Paid | Tax Assessment Tax Assessment Total Assessment is a certain percentage of the fair market value that is determined by local assessors to be the total taxable value of land and additions on the property. | Land | Improvement |
|---|---|---|---|---|
| 2024 | $781 | $52,772 | $11,579 | $41,193 |
| 2023 | $683 | $48,320 | $10,526 | $37,794 |
| 2022 | $587 | $39,693 | $8,421 | $31,272 |
| 2021 | $582 | $36,495 | $8,421 | $28,074 |
| 2020 | $591 | $33,514 | $6,579 | $26,935 |
| 2019 | $580 | $32,279 | $6,579 | $25,700 |
| 2018 | $1,099 | $30,979 | $6,579 | $24,400 |
| 2017 | $1,076 | $30,355 | $6,579 | $23,776 |
| 2016 | $1,067 | $30,024 | $6,560 | $23,464 |
| 2015 | $1,009 | $30,024 | $6,560 | $23,464 |
| 2014 | $1,009 | $30,024 | $6,560 | $23,464 |
Source: Public Records
Map
Nearby Homes
- 111 Hosea St SW
- 14 Clover St SW
- 7 Willingham St SW
- 2014 Maple Ave SW
- 2108 Maple Ave SW
- 304 E 19th St SW
- 1705 Olmstead St SW
- 414 E 17th St SW
- 107 E Linden St SE
- 2107 Rockmart Rd SE
- 1901 Hull Ave SW
- 000 E Oglethorpe Hwy
- 2501 Maple Rd SE
- 0 Martha Berry Hwy Unit 7525627
- 0 Martha Berry Hwy Unit 7614774
- 0 Martha Berry Hwy Unit 10563404
- 1502 Spring Creek St SW
- 2508 Maple Rd SE
- 39 E 16th St SW
- 4 E 15th St SW
- 0 Flannery St SW Unit 11273972
- 0 Flannery St SW Unit 3159188
- 0 Flannery St SW Unit 8858802
- 0 Flannery St SW Unit 8822678
- 0 Flannery St SW Unit 8246190
- 0 Flannery St SW Unit 7205648
- 0 Flannery St SW Unit 3090670
- 27 Worsham St SW
- 2022 Flannery St SW
- 29 Worsham St SW
- 28 Worsham St SW
- 25 Worsham St SW
- 26 Worsham St SW
- 35 Willingham St SW
- 21 Worsham St SW
- 24 Worsham St SW
- 2015 Flannery St SW
- 31 Willingham St SW
- 2012 Flannery St SW
- 2013 Flannery St SW