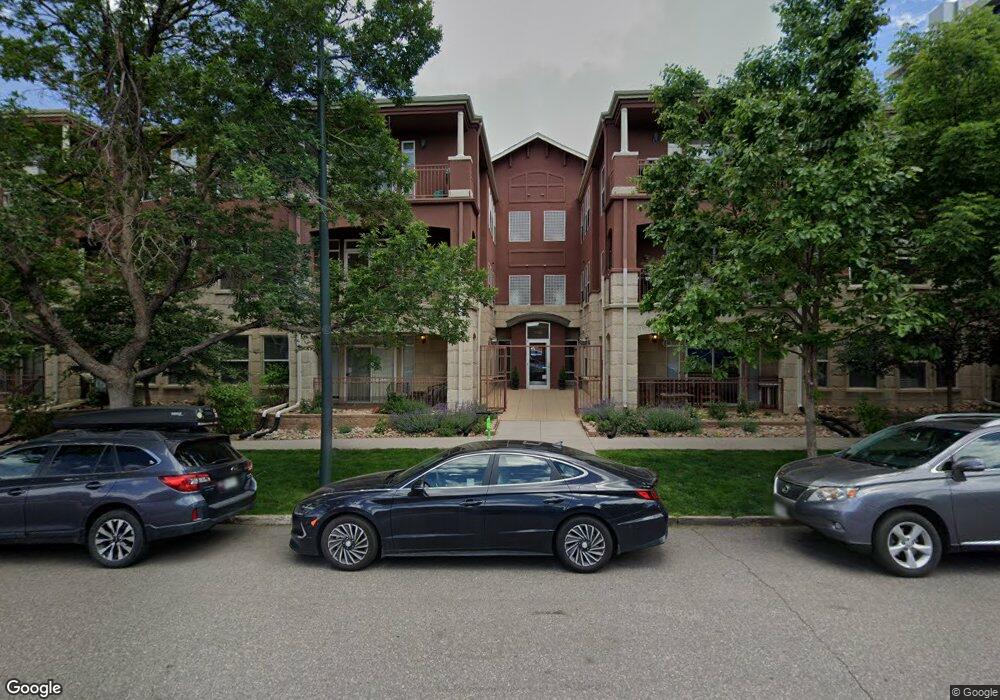
2100 Humboldt St Unit 304 Denver, CO 80205
City Park West NeighborhoodEstimated Value: $533,960 - $570,000
2
Beds
2
Baths
1,295
Sq Ft
$430/Sq Ft
Est. Value
About This Home
This home is located at 2100 Humboldt St Unit 304, Denver, CO 80205 and is currently estimated at $557,490, approximately $430 per square foot. 2100 Humboldt St Unit 304 is a home located in Denver County with nearby schools including Whittier ECE-8 School, Cole Arts & Science Academy, and McAuliffe Manual Middle School.
Ownership History
Date
Name
Owned For
Owner Type
Purchase Details
Closed on
Oct 21, 2016
Sold by
Peck J Ryan Louis
Bought by
Klevesahl Michelle Lynn
Current Estimated Value
Purchase Details
Closed on
Sep 19, 2014
Sold by
Cortright Jeremy
Bought by
Louise Peck J Ryan
Home Financials for this Owner
Home Financials are based on the most recent Mortgage that was taken out on this home.
Original Mortgage
$324,000
Interest Rate
3.87%
Mortgage Type
Adjustable Rate Mortgage/ARM
Purchase Details
Closed on
Dec 30, 2004
Sold by
The Uptown Group Llc
Bought by
Cortright Jeremy
Home Financials for this Owner
Home Financials are based on the most recent Mortgage that was taken out on this home.
Original Mortgage
$261,600
Interest Rate
4.87%
Mortgage Type
Purchase Money Mortgage
Create a Home Valuation Report for This Property
The Home Valuation Report is an in-depth analysis detailing your home's value as well as a comparison with similar homes in the area
Home Values in the Area
Average Home Value in this Area
Purchase History
| Date | Buyer | Sale Price | Title Company |
|---|---|---|---|
| Klevesahl Michelle Lynn | $390,000 | First Integrity Title | |
| Louise Peck J Ryan | $360,000 | Land Title Guarantee Company | |
| Cortright Jeremy | $327,055 | -- |
Source: Public Records
Mortgage History
| Date | Status | Borrower | Loan Amount |
|---|---|---|---|
| Previous Owner | Louise Peck J Ryan | $324,000 | |
| Previous Owner | Cortright Jeremy | $261,600 | |
| Closed | Cortright Jeremy | $49,100 |
Source: Public Records
Tax History Compared to Growth
Tax History
| Year | Tax Paid | Tax Assessment Tax Assessment Total Assessment is a certain percentage of the fair market value that is determined by local assessors to be the total taxable value of land and additions on the property. | Land | Improvement |
|---|---|---|---|---|
| 2024 | $2,709 | $34,200 | $2,370 | $31,830 |
| 2023 | $2,650 | $34,200 | $2,370 | $31,830 |
| 2022 | $2,609 | $32,810 | $2,450 | $30,360 |
| 2021 | $2,518 | $33,750 | $2,520 | $31,230 |
| 2020 | $2,394 | $32,270 | $2,330 | $29,940 |
| 2019 | $2,327 | $32,270 | $2,330 | $29,940 |
| 2018 | $2,316 | $29,940 | $2,150 | $27,790 |
| 2017 | $2,309 | $29,940 | $2,150 | $27,790 |
| 2016 | $2,090 | $25,630 | $1,297 | $24,333 |
| 2015 | $2,002 | $25,630 | $1,297 | $24,333 |
| 2014 | $1,694 | $20,400 | $1,433 | $18,967 |
Source: Public Records
Map
Nearby Homes
- 2100 N Franklin St Unit 12
- 2100 N Franklin St Unit 5
- 2100 N Franklin St Unit 7
- 2100 N Franklin St Unit 20
- 2100 N Franklin St Unit 8
- 2218 Gilpin St
- 2120 N Downing St Unit 209
- 2239 N Williams St
- 2311 N Marion St
- 2147 N Downing St
- 1833 N Williams St Unit 306
- 1833 N Williams St Unit 307
- 1833 N Williams St Unit 101
- 1815 N Williams St
- 1021 E 23rd Ave
- 1760 N Franklin St Unit 5
- 2047 N Race St
- 924 E 22nd Ave
- 2201 N Ogden St Unit 1
- 1424 E 25th Ave
- 2100 Humboldt St Unit 310
- 2100 Humboldt St Unit 309
- 2100 Humboldt St Unit 308
- 2100 Humboldt St Unit 307
- 2100 Humboldt St Unit 306
- 2100 Humboldt St Unit 305
- 2100 Humboldt St Unit 303
- 2100 Humboldt St Unit 302
- 2100 Humboldt St Unit 301
- 2100 Humboldt St Unit 210
- 2100 Humboldt St Unit 209
- 2100 Humboldt St Unit 203
- 2100 Humboldt St Unit 207
- 2100 Humboldt St Unit 206
- 2100 Humboldt St Unit 205
- 2100 Humboldt St
- 2100 Humboldt St Unit 203
- 2100 Humboldt St Unit 202
- 2100 Humboldt St Unit 201
- 2100 Humboldt St Unit 110