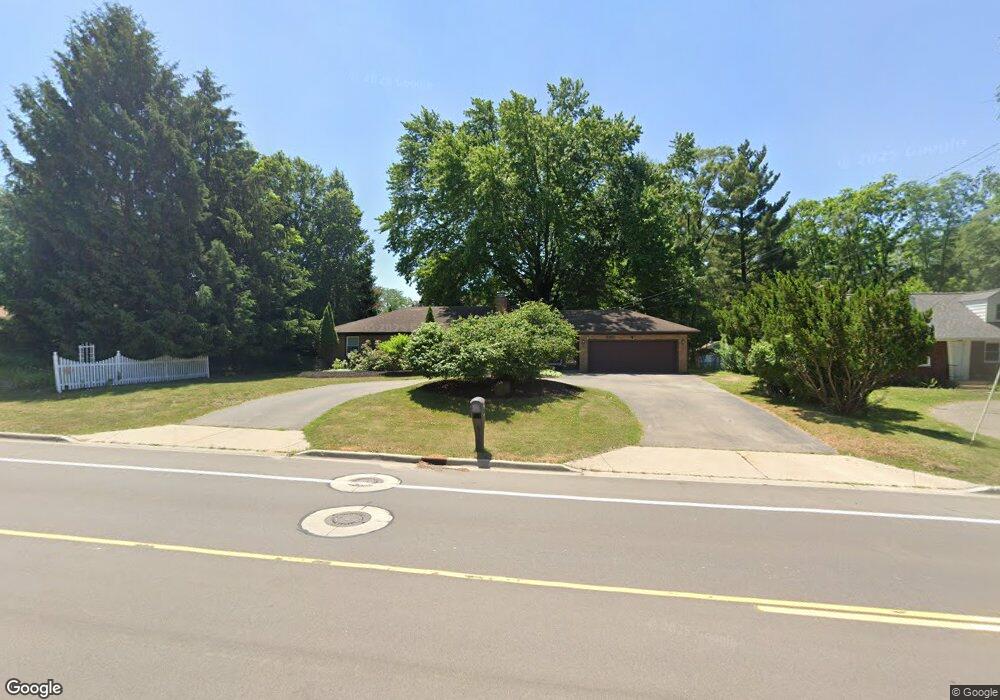
2100 Knapp St NE Grand Rapids, MI 49505
North East Citizens Action NeighborhoodEstimated Value: $358,659 - $404,000
--
Bed
1
Bath
1,791
Sq Ft
$214/Sq Ft
Est. Value
About This Home
This home is located at 2100 Knapp St NE, Grand Rapids, MI 49505 and is currently estimated at $382,665, approximately $213 per square foot. 2100 Knapp St NE is a home located in Kent County with nearby schools including Riverside Middle School, Union High School, and Knapp Charter Academy.
Ownership History
Date
Name
Owned For
Owner Type
Purchase Details
Closed on
May 10, 2013
Sold by
Boomgaard Roberta K
Bought by
Boomgaard Roberta K and The Charles M & Roberta K Boomgaard Livi
Current Estimated Value
Purchase Details
Closed on
May 9, 2013
Sold by
Boomgaard Charles M
Bought by
Boomgaard Roberta K
Purchase Details
Closed on
Sep 24, 2012
Sold by
Boomgaard Roberta K
Bought by
Boomgaard Charles M and Boomgaard Roberta K
Purchase Details
Closed on
Sep 7, 2012
Sold by
Boomgaard Charles M and Boomgaard Roberta K
Bought by
The Charles M & Roberta K Boomgaard Livi
Purchase Details
Closed on
Dec 2, 2010
Sold by
Boomgaard Charles M and Boomgaard Roberta
Bought by
Boomgaard Charles M and Boomgaard Roberta K
Purchase Details
Closed on
Jul 8, 1987
Purchase Details
Closed on
Jul 7, 1987
Purchase Details
Closed on
Nov 29, 1983
Purchase Details
Closed on
Oct 13, 1983
Create a Home Valuation Report for This Property
The Home Valuation Report is an in-depth analysis detailing your home's value as well as a comparison with similar homes in the area
Home Values in the Area
Average Home Value in this Area
Purchase History
| Date | Buyer | Sale Price | Title Company |
|---|---|---|---|
| Boomgaard Roberta K | -- | None Available | |
| Boomgaard Roberta K | -- | None Available | |
| Boomgaard Charles M | -- | None Available | |
| The Charles M & Roberta K Boomgaard Livi | -- | None Available | |
| Boomgaard Charles M | -- | None Available | |
| -- | $75,000 | -- | |
| -- | $78,900 | -- | |
| -- | $78,900 | -- | |
| -- | $60,500 | -- |
Source: Public Records
Tax History Compared to Growth
Tax History
| Year | Tax Paid | Tax Assessment Tax Assessment Total Assessment is a certain percentage of the fair market value that is determined by local assessors to be the total taxable value of land and additions on the property. | Land | Improvement |
|---|---|---|---|---|
| 2025 | $3,862 | $176,000 | $0 | $0 |
| 2024 | $3,862 | $168,100 | $0 | $0 |
| 2023 | $3,918 | $159,500 | $0 | $0 |
| 2022 | $3,720 | $141,600 | $0 | $0 |
| 2021 | $3,637 | $136,100 | $0 | $0 |
| 2020 | $3,124 | $113,400 | $0 | $0 |
| 2019 | $3,272 | $107,300 | $0 | $0 |
| 2018 | $3,160 | $103,100 | $0 | $0 |
| 2017 | $3,077 | $90,800 | $0 | $0 |
| 2016 | $3,113 | $87,900 | $0 | $0 |
| 2015 | $2,896 | $87,900 | $0 | $0 |
| 2013 | -- | $88,100 | $0 | $0 |
Source: Public Records
Map
Nearby Homes
- 2041 Krislin St
- 2016 Tall Meadow St NE
- 2037 Tall Meadow St NE Unit 13
- 2058 Ken Ade St NE Unit 147
- 2324 Whimbrel Ct NE
- 2112 Jo Dean Ct NE
- 1759 Briarcliff Dr NE
- 1600 Cherry Hill Dr NE
- 2151 Chelsea Rd NE
- 2753 Dean Lake Ave NE
- 2420 Hylane Ct NE
- 1410 Rothbury Dr NE
- 1336 Banbury Ave NE
- 2353 Midvale St NE
- 1739 Waldorn Ave NE
- 1524 Sweet St NE
- 1261 Banbury Ave NE
- 1455 Ball Ave NE
- 1250 Walwood Dr NE
- 2078 Celadon Dr NE Unit 92
- 2088 Knapp St NE
- 2120 Knapp St NE
- 1953 Orchard Ln NE
- 2019 Palmerton Ct NE
- 2018 Palmerton Ct NE
- 2021 Palmerton Ct NE Unit 77
- 2020 Palmerton Ct NE
- 2150 Knapp St NE
- 1937 Orchard Ln NE
- 2023 Palmerton Ct NE Unit 78
- 2070 Knapp St NE
- 2067 Knapp St NE
- 1952 Orchard Ln NE
- 2026 Palmerton Ct NE
- 2033 Palmerton Ct NE
- 2033 Palmerton Ct NE Unit 79
- 2029 Bryceway Ct NE
- 2017 Bryceway Ct NE
- 2017 Bryceway Ct NE
- 1921 Orchard Ln NE