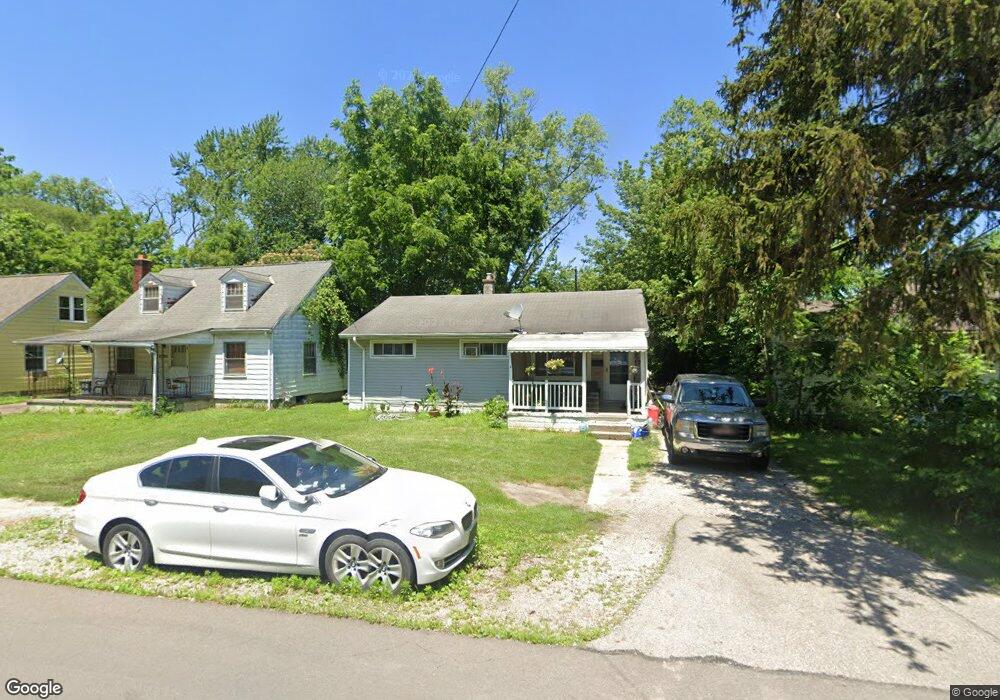
2100 Lehner Rd Columbus, OH 43224
North Linden NeighborhoodEstimated Value: $158,269 - $195,000
3
Beds
1
Bath
888
Sq Ft
$200/Sq Ft
Est. Value
About This Home
This home is located at 2100 Lehner Rd, Columbus, OH 43224 and is currently estimated at $177,817, approximately $200 per square foot. 2100 Lehner Rd is a home located in Franklin County with nearby schools including North Linden Elementary School, Medina Middle School, and Mifflin High School.
Ownership History
Date
Name
Owned For
Owner Type
Purchase Details
Closed on
Jul 17, 2015
Sold by
Mitchell Tracy
Bought by
Everett Frank C and Everett Sonja B
Current Estimated Value
Home Financials for this Owner
Home Financials are based on the most recent Mortgage that was taken out on this home.
Original Mortgage
$68,732
Outstanding Balance
$54,406
Interest Rate
4.62%
Mortgage Type
FHA
Estimated Equity
$123,411
Purchase Details
Closed on
Nov 7, 2014
Sold by
Barnett Sonia R
Bought by
Mitchell Tracy
Purchase Details
Closed on
Apr 30, 1999
Sold by
Manning Dolores M
Bought by
Mitchell Tracy and Barnett Sonia
Home Financials for this Owner
Home Financials are based on the most recent Mortgage that was taken out on this home.
Original Mortgage
$67,940
Interest Rate
7.04%
Mortgage Type
FHA
Purchase Details
Closed on
Jul 3, 1987
Bought by
Manning James R
Create a Home Valuation Report for This Property
The Home Valuation Report is an in-depth analysis detailing your home's value as well as a comparison with similar homes in the area
Home Values in the Area
Average Home Value in this Area
Purchase History
| Date | Buyer | Sale Price | Title Company |
|---|---|---|---|
| Everett Frank C | $70,000 | Bxpm Title Bo | |
| Mitchell Tracy | -- | None Available | |
| Mitchell Tracy | $68,500 | Connor Title Co | |
| Manning James R | $29,000 | -- |
Source: Public Records
Mortgage History
| Date | Status | Borrower | Loan Amount |
|---|---|---|---|
| Open | Everett Frank C | $68,732 | |
| Previous Owner | Mitchell Tracy | $67,940 |
Source: Public Records
Tax History
| Year | Tax Paid | Tax Assessment Tax Assessment Total Assessment is a certain percentage of the fair market value that is determined by local assessors to be the total taxable value of land and additions on the property. | Land | Improvement |
|---|---|---|---|---|
| 2025 | $2,463 | $42,640 | $8,720 | $33,920 |
| 2024 | $2,463 | $42,640 | $8,720 | $33,920 |
| 2023 | $2,436 | $42,630 | $8,715 | $33,915 |
| 2022 | $1,573 | $21,600 | $5,320 | $16,280 |
| 2021 | $1,575 | $21,600 | $5,320 | $16,280 |
| 2020 | $1,577 | $21,600 | $5,320 | $16,280 |
| 2019 | $1,359 | $17,220 | $4,270 | $12,950 |
| 2018 | $1,490 | $17,220 | $4,270 | $12,950 |
| 2017 | $1,582 | $17,220 | $4,270 | $12,950 |
| 2016 | $1,808 | $20,730 | $3,470 | $17,260 |
| 2015 | $1,622 | $20,730 | $3,470 | $17,260 |
| 2014 | $1,625 | $20,730 | $3,470 | $17,260 |
| 2013 | -- | $23,030 | $3,850 | $19,180 |
Source: Public Records
Map
Nearby Homes
- 2100 Ferris Rd
- 2023 Ferris Rd
- 1946 Lehner Rd
- 1997 Ferris Rd
- 2045 Sale Rd
- 2283 Ward Rd
- 2299 Belcher Dr
- 2267 Ferris Rd
- 2298 Belcher Dr
- 1863 Ward Rd
- 1874 Sale Rd
- 2081 Ormond Ave
- 4090 Cleveland Ave
- 1734 Ferris Rd
- 2010 Melrose Ave
- 4123 Arbury Ln
- 1637 Sale Rd
- 2583 Milverton Way
- 3750 Dresden St
- 2594 Adda Ave
Your Personal Tour Guide
Ask me questions while you tour the home.