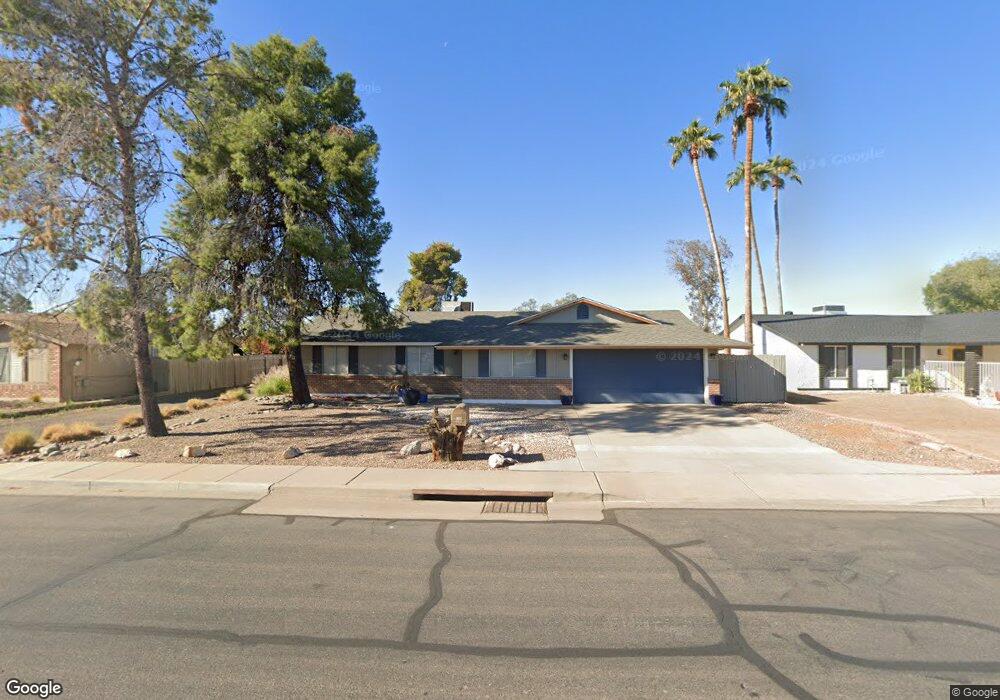
2100 N Pennington Dr Chandler, AZ 85224
Amberwood NeighborhoodEstimated Value: $444,426 - $470,000
3
Beds
2
Baths
1,290
Sq Ft
$354/Sq Ft
Est. Value
About This Home
This home is located at 2100 N Pennington Dr, Chandler, AZ 85224 and is currently estimated at $456,357, approximately $353 per square foot. 2100 N Pennington Dr is a home located in Maricopa County with nearby schools including Pomeroy Elementary School, Franklin at Brimhall Elementary School, and Summit Academy Elementary.
Ownership History
Date
Name
Owned For
Owner Type
Purchase Details
Closed on
Oct 14, 2011
Sold by
Stallings Krista and Stallings Scott
Bought by
Harvey John C
Current Estimated Value
Home Financials for this Owner
Home Financials are based on the most recent Mortgage that was taken out on this home.
Original Mortgage
$126,704
Outstanding Balance
$87,040
Interest Rate
4.25%
Mortgage Type
FHA
Estimated Equity
$369,317
Purchase Details
Closed on
Jun 28, 2011
Sold by
Wells Fargo Bank Na
Bought by
Stallings Krista and Stallings Scott
Purchase Details
Closed on
Oct 7, 2010
Sold by
Womboldt Kenneth R and Womboldt Jane G
Bought by
Wells Fargo Bank Na
Purchase Details
Closed on
Jul 21, 1998
Sold by
Adkins Jeffrey C and Adkins Linda K
Bought by
Womboldt Kenneth R and Womboldt Jane G
Home Financials for this Owner
Home Financials are based on the most recent Mortgage that was taken out on this home.
Original Mortgage
$112,009
Interest Rate
6.9%
Mortgage Type
FHA
Create a Home Valuation Report for This Property
The Home Valuation Report is an in-depth analysis detailing your home's value as well as a comparison with similar homes in the area
Home Values in the Area
Average Home Value in this Area
Purchase History
| Date | Buyer | Sale Price | Title Company |
|---|---|---|---|
| Harvey John C | $130,000 | Fidelity Natl Title Ins Co | |
| Stallings Krista | $70,000 | Fidelity National Title Grou | |
| Wells Fargo Bank Na | $184,600 | Accommodation | |
| Womboldt Kenneth R | $113,000 | Chicago Title Insurance Co |
Source: Public Records
Mortgage History
| Date | Status | Borrower | Loan Amount |
|---|---|---|---|
| Open | Harvey John C | $126,704 | |
| Previous Owner | Womboldt Kenneth R | $112,009 |
Source: Public Records
Tax History Compared to Growth
Tax History
| Year | Tax Paid | Tax Assessment Tax Assessment Total Assessment is a certain percentage of the fair market value that is determined by local assessors to be the total taxable value of land and additions on the property. | Land | Improvement |
|---|---|---|---|---|
| 2025 | $1,309 | $15,352 | -- | -- |
| 2024 | $1,321 | $14,621 | -- | -- |
| 2023 | $1,321 | $31,580 | $6,310 | $25,270 |
| 2022 | $1,285 | $23,430 | $4,680 | $18,750 |
| 2021 | $1,293 | $21,630 | $4,320 | $17,310 |
| 2020 | $1,278 | $19,610 | $3,920 | $15,690 |
| 2019 | $1,177 | $18,070 | $3,610 | $14,460 |
| 2018 | $1,143 | $16,330 | $3,260 | $13,070 |
| 2017 | $1,099 | $15,070 | $3,010 | $12,060 |
| 2016 | $1,075 | $14,270 | $2,850 | $11,420 |
| 2015 | $1,012 | $14,020 | $2,800 | $11,220 |
Source: Public Records
Map
Nearby Homes
- 2129 N Villas Ln
- 2015 N Villas Ln
- 1771 W Mariposa Ct
- 1417 W Los Arboles Place
- 1704 W Rosal Dr
- 1511 W Mesquite St
- 1403 W Los Arboles Place
- 2103 W Palomino Dr
- 1719 N Cholla St
- 1645 N Saguaro St
- 2100 W Lemon Tree Place Unit 68
- 2100 W Lemon Tree Place Unit 29
- 2100 W Lemon Tree Place Unit 78
- 1913 N Verano Way
- 1621 N Longmore St
- 1821 W Mission Dr
- 1807 W Mission Dr
- 2210 N Los Altos Dr
- 1224 W Mesquite St
- 2029 W Shawnee Dr
- 2028 N Pennington Dr
- 2108 N Pennington Dr
- 1618 W Mariposa Dr
- 2024 N Pennington Dr
- 1617 W Mariposa Dr
- 2112 N Pennington Dr
- 1614 W Mariposa Dr
- 1619 W Colt Rd
- 2020 N Pennington Dr
- 1711 W Colt Ct
- 1715 W Colt Ct
- 1613 W Mariposa Dr
- 2116 N Pennington Dr
- 1615 W Colt Rd
- 1616 W Los Arboles Place
- 1610 W Mariposa Dr
- 1609 W Mariposa Dr
- 1611 W Colt Rd
- 1612 W Los Arboles Place Unit 9
- 1616 W Colt Rd