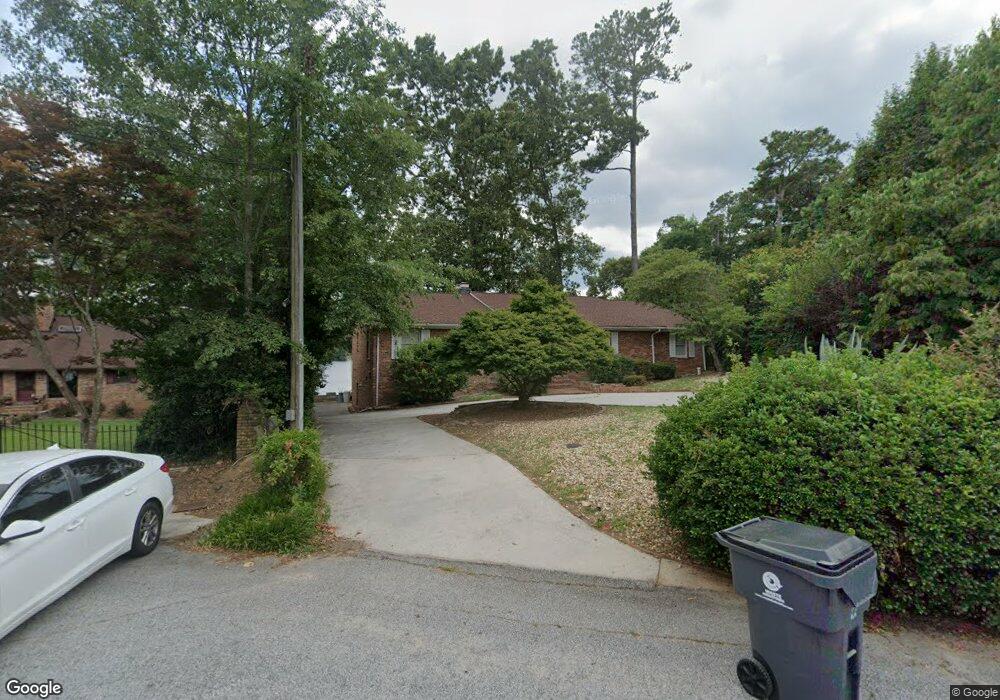
2100 Napoli Cir Unit 12A Conyers, GA 30012
Estimated Value: $366,078 - $392,000
4
Beds
3
Baths
2,560
Sq Ft
$149/Sq Ft
Est. Value
About This Home
This home is located at 2100 Napoli Cir Unit 12A, Conyers, GA 30012 and is currently estimated at $380,270, approximately $148 per square foot. 2100 Napoli Cir Unit 12A is a home located in Rockdale County with nearby schools including House Elementary School, Edwards Middle School, and Rockdale County High School.
Ownership History
Date
Name
Owned For
Owner Type
Purchase Details
Closed on
Feb 29, 2016
Sold by
Bustillo Esther C
Bought by
Walker Freddie Lee
Current Estimated Value
Home Financials for this Owner
Home Financials are based on the most recent Mortgage that was taken out on this home.
Original Mortgage
$169,866
Outstanding Balance
$137,575
Interest Rate
4.37%
Mortgage Type
FHA
Estimated Equity
$242,695
Purchase Details
Closed on
Oct 14, 2015
Sold by
Bustillo Esther C
Bought by
Lavisky Alicia B and Johns Amabella
Purchase Details
Closed on
Dec 19, 2003
Sold by
Dixon John G
Bought by
Bustillo Arcadio P and Bustillo Esther
Home Financials for this Owner
Home Financials are based on the most recent Mortgage that was taken out on this home.
Original Mortgage
$149,900
Interest Rate
5.87%
Mortgage Type
New Conventional
Purchase Details
Closed on
Apr 20, 1995
Sold by
Curry William J Delores
Bought by
Dixon John G
Create a Home Valuation Report for This Property
The Home Valuation Report is an in-depth analysis detailing your home's value as well as a comparison with similar homes in the area
Home Values in the Area
Average Home Value in this Area
Purchase History
| Date | Buyer | Sale Price | Title Company |
|---|---|---|---|
| Walker Freddie Lee | $173,000 | -- | |
| Lavisky Alicia B | -- | -- | |
| Bustillo Arcadio P | $199,900 | -- | |
| Dixon John G | $171,000 | -- |
Source: Public Records
Mortgage History
| Date | Status | Borrower | Loan Amount |
|---|---|---|---|
| Open | Walker Freddie Lee | $169,866 | |
| Previous Owner | Bustillo Arcadio P | $149,900 |
Source: Public Records
Tax History Compared to Growth
Tax History
| Year | Tax Paid | Tax Assessment Tax Assessment Total Assessment is a certain percentage of the fair market value that is determined by local assessors to be the total taxable value of land and additions on the property. | Land | Improvement |
|---|---|---|---|---|
| 2024 | $6,042 | $152,760 | $31,480 | $121,280 |
| 2023 | $6,147 | $151,560 | $28,800 | $122,760 |
| 2022 | $4,943 | $121,240 | $23,000 | $98,240 |
| 2021 | $4,271 | $105,360 | $16,680 | $88,680 |
| 2020 | $4,453 | $104,080 | $16,000 | $88,080 |
| 2019 | $3,612 | $80,080 | $10,000 | $70,080 |
| 2018 | $3,538 | $78,080 | $8,000 | $70,080 |
| 2017 | $3,156 | $68,960 | $8,000 | $60,960 |
| 2016 | $3,234 | $70,680 | $8,000 | $62,680 |
| 2015 | $2,919 | $63,680 | $7,000 | $56,680 |
| 2014 | $2,944 | $63,560 | $7,000 | $56,560 |
| 2013 | -- | $56,640 | $8,480 | $48,160 |
Source: Public Records
Map
Nearby Homes
- 2743 Lake Capri Dr
- 2586 Lake Capri Dr
- 2578 Lake Capri Dr
- 2016 Gibralter Way
- 2504 Amalfi Dr
- CAPRI Capri Cove
- CAPRI NORTHWEST Capri Cove
- 2550 Amalfi Dr
- 2956 Barcelona Way
- 2966 Riviera Dr NW
- 2527 Amalfi Dr
- 2934 Union Grove Rd
- 7977 Union Grove
- 2545 Rockbridge Rd NW
- 2272 Malta Dr
- 2970 Lake Sorrento Ct
- 3014 Barcelona Way
- 2949 Lake Sorrento Ct
- 2530 Rockbridge Rd NW
- 3107 Riviera Dr
- 2100 Napoli Cir
- 2094 Napoli Cir
- 2744 Lake Capri Dr
- 2090 Napoli Cir
- 2754 Lake Capri Dr
- 2091 Napoli Cir
- 2101 Napoli Cir
- 0 Napoli Cir
- 2758 Lake Capri Dr
- 2738 Lake Capri Dr
- 2738 Lake Capri Dr Unit 2738
- 2760 Lake Capri Dr
- 2732 Lake Capri Dr
- 2670 Lake Capri Dr
- 2749 Lake Capri Dr
- 2762 Lake Capri Dr
- 2724 Lake Capri Dr Unit 1
- 2737 Lake Capri Dr
- 2755 Lake Capri Dr
- 2731 Lake Capri Dr