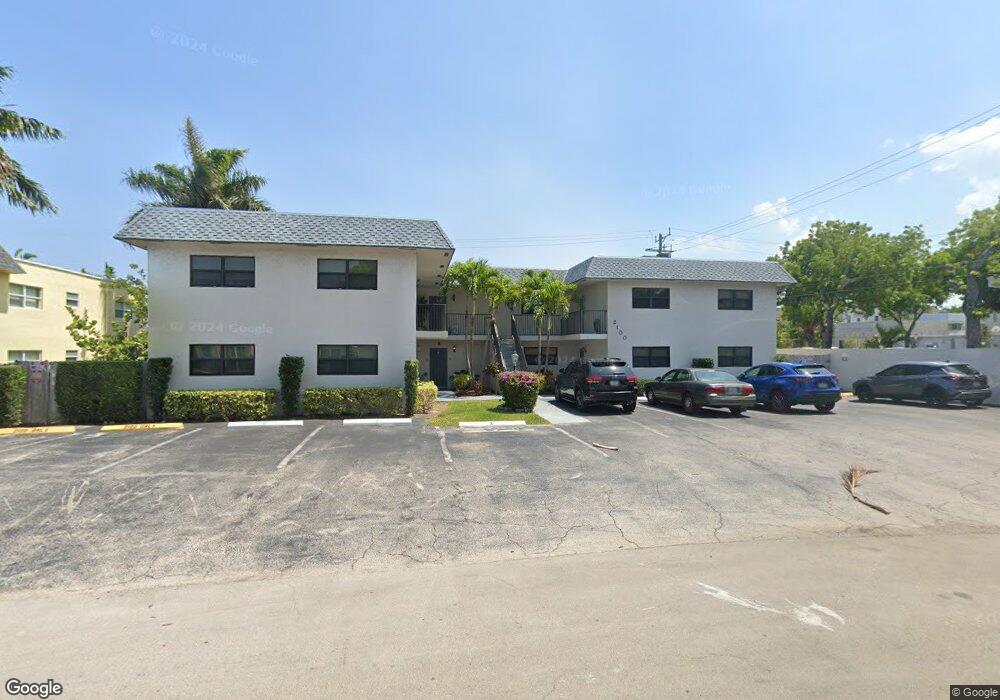
2100 NE 42nd Ct Unit D Lighthouse Point, FL 33064
Estimated Value: $134,000 - $152,000
1
Bed
1
Bath
790
Sq Ft
$177/Sq Ft
Est. Value
About This Home
This home is located at 2100 NE 42nd Ct Unit D, Lighthouse Point, FL 33064 and is currently estimated at $139,804, approximately $176 per square foot. 2100 NE 42nd Ct Unit D is a home located in Broward County with nearby schools including Norcrest Elementary School, Deerfield Beach Middle School, and Deerfield Beach High School.
Ownership History
Date
Name
Owned For
Owner Type
Purchase Details
Closed on
Apr 17, 2012
Sold by
Schiffer Ronald
Bought by
Lhp Properties Llc
Current Estimated Value
Purchase Details
Closed on
Apr 19, 2011
Sold by
Retained Realty Inc
Bought by
Schiffer Ronald
Purchase Details
Closed on
Apr 13, 2011
Sold by
Emigrant Mortgage Company Inc
Bought by
Retained Realty Inc
Purchase Details
Closed on
Nov 16, 2010
Sold by
Johansen Olga
Bought by
Emigrant Mtg Co Inc
Purchase Details
Closed on
Nov 12, 2004
Sold by
Gilson Harold J and Gilson Hermina J
Bought by
Johansen Olga
Purchase Details
Closed on
Sep 9, 2002
Sold by
Cassells Courtney and Cassells Michael
Bought by
Francis Sandra R
Purchase Details
Closed on
Sep 7, 1996
Sold by
Gilson Harold J and Gilson Hermina
Bought by
Gilson Harold J and Gilson Hermina
Create a Home Valuation Report for This Property
The Home Valuation Report is an in-depth analysis detailing your home's value as well as a comparison with similar homes in the area
Home Values in the Area
Average Home Value in this Area
Purchase History
| Date | Buyer | Sale Price | Title Company |
|---|---|---|---|
| Lhp Properties Llc | -- | None Available | |
| Schiffer Ronald | $35,500 | Attorney | |
| Retained Realty Inc | -- | Attorney | |
| Emigrant Mtg Co Inc | -- | None Available | |
| Johansen Olga | $98,000 | New Republic Title Inc | |
| Francis Sandra R | -- | Excel One Title Services Inc | |
| Gilson Harold J | $100 | -- |
Source: Public Records
Tax History
| Year | Tax Paid | Tax Assessment Tax Assessment Total Assessment is a certain percentage of the fair market value that is determined by local assessors to be the total taxable value of land and additions on the property. | Land | Improvement |
|---|---|---|---|---|
| 2026 | $3,153 | $119,490 | $11,950 | $107,540 |
| 2025 | $2,911 | $108,620 | $10,860 | $97,760 |
| 2024 | $2,794 | $108,620 | $10,860 | $97,760 |
| 2023 | $2,794 | $101,490 | $10,150 | $91,340 |
| 2022 | $2,398 | $94,410 | $9,440 | $84,970 |
| 2021 | $2,305 | $89,700 | $8,970 | $80,730 |
| 2020 | $2,174 | $85,830 | $8,580 | $77,250 |
| 2019 | $2,058 | $79,790 | $7,980 | $71,810 |
| 2018 | $1,909 | $78,210 | $7,820 | $70,390 |
| 2017 | $1,761 | $67,070 | $0 | $0 |
| 2016 | $1,683 | $60,980 | $0 | $0 |
| 2015 | $1,325 | $55,440 | $0 | $0 |
| 2014 | $1,094 | $50,400 | $0 | $0 |
| 2013 | -- | $45,820 | $4,580 | $41,240 |
Source: Public Records
Map
Nearby Homes
- 2131 NE 42nd Ct Unit 208E
- 2131 NE 42nd Ct Unit 104E
- 2131 NE 42nd Ct Unit 211E
- 2131 NE 42nd Ct Unit 106E
- 2131 NE 42nd Ct Unit 210E
- 2115 NE 42nd Ct Unit 104N
- 2131 NE 42nd Ct Unit 202E
- 2131 NE 42nd Ct Unit 209E
- 2337 Vintage Dr
- 2318 Vintage Dr
- 2344 Vintage Dr
- 2161 NE 42nd Ct Unit 114
- 2161 NE 42nd Ct Unit 215
- 2329 Vintage Dr
- 2151 NE 42nd Ct Unit 237E
- 2151 NE 42nd Ct Unit 136
- 2151 NE 42nd Ct Unit 123
- 2122 NE 44th St
- 2317 Vintage Dr
- 2131 NE 40th Ct
- 2100 NE 42nd Ct Unit A
- 2100 NE 42nd Ct Unit F
- 2100 NE 42nd Ct Unit C
- 2100 NE 42nd Ct Unit B
- 2100 NE 42nd Ct Unit E
- 2120 NE 42nd Ct Unit D
- 2120 NE 42nd Ct
- 2120 NE 42nd Ct Unit 4
- 2120 NE 42nd Ct Unit 1
- 2120 NE 42nd Ct Unit 7
- 2120 NE 42nd Ct Unit 5
- 2120 NE 42nd Ct
- 4153 NE 21st Terrace
- 4155 NE 21st Terrace Unit 4153
- 4155 NE 21st Terrace
- 4133 NE 21st Terrace
- 4157 NE 21st Terrace
- 4159 NE 21st Terrace
Your Personal Tour Guide
Ask me questions while you tour the home.