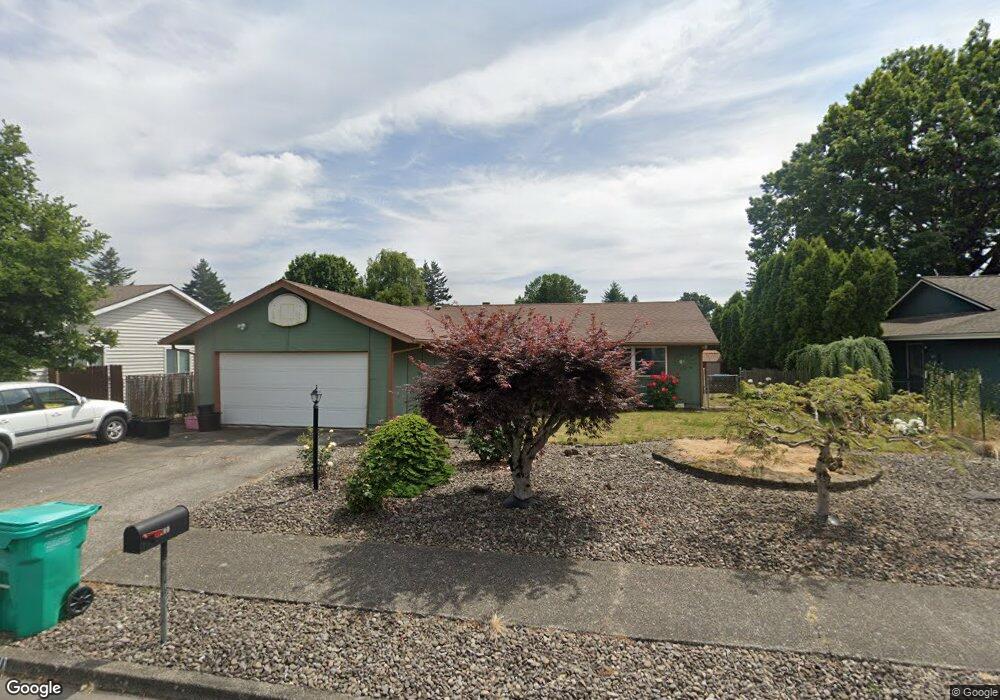
2100 NE Liberty Ave Gresham, OR 97030
North Central NeighborhoodEstimated Value: $368,000 - $433,000
3
Beds
1
Bath
1,008
Sq Ft
$400/Sq Ft
Est. Value
About This Home
This home is located at 2100 NE Liberty Ave, Gresham, OR 97030 and is currently estimated at $403,241, approximately $400 per square foot. 2100 NE Liberty Ave is a home located in Multnomah County with nearby schools including Highland Elementary School, Clear Creek Middle School, and Gresham High School.
Ownership History
Date
Name
Owned For
Owner Type
Purchase Details
Closed on
May 25, 2010
Sold by
Nunez Nancy Y
Bought by
Nunez Martin
Current Estimated Value
Home Financials for this Owner
Home Financials are based on the most recent Mortgage that was taken out on this home.
Original Mortgage
$120,000
Outstanding Balance
$80,043
Interest Rate
5.03%
Mortgage Type
New Conventional
Estimated Equity
$323,198
Purchase Details
Closed on
May 17, 1999
Sold by
Nunez Nancy Y and Nunez Martin
Bought by
Nunez Nancy Y and Nunez Martin
Home Financials for this Owner
Home Financials are based on the most recent Mortgage that was taken out on this home.
Original Mortgage
$115,500
Interest Rate
6.92%
Mortgage Type
Purchase Money Mortgage
Purchase Details
Closed on
Jul 15, 1996
Sold by
Teyema Timothy B
Bought by
Nunez Nancy Y and Nunez Martin
Home Financials for this Owner
Home Financials are based on the most recent Mortgage that was taken out on this home.
Original Mortgage
$110,123
Interest Rate
8.3%
Mortgage Type
FHA
Create a Home Valuation Report for This Property
The Home Valuation Report is an in-depth analysis detailing your home's value as well as a comparison with similar homes in the area
Home Values in the Area
Average Home Value in this Area
Purchase History
| Date | Buyer | Sale Price | Title Company |
|---|---|---|---|
| Nunez Martin | -- | Chicago Title | |
| Nunez Nancy Y | -- | Pacific Nw Title | |
| Nunez Nancy Y | $110,950 | Ticor Title Insurance |
Source: Public Records
Mortgage History
| Date | Status | Borrower | Loan Amount |
|---|---|---|---|
| Open | Nunez Martin | $120,000 | |
| Closed | Nunez Nancy Y | $115,500 | |
| Closed | Nunez Nancy Y | $110,123 |
Source: Public Records
Tax History Compared to Growth
Tax History
| Year | Tax Paid | Tax Assessment Tax Assessment Total Assessment is a certain percentage of the fair market value that is determined by local assessors to be the total taxable value of land and additions on the property. | Land | Improvement |
|---|---|---|---|---|
| 2025 | $3,863 | $189,840 | -- | -- |
| 2024 | $3,698 | $184,320 | -- | -- |
| 2023 | $3,369 | $178,960 | $0 | $0 |
| 2022 | $3,275 | $173,750 | $0 | $0 |
| 2021 | $3,193 | $168,690 | $0 | $0 |
| 2020 | $3,004 | $163,780 | $0 | $0 |
| 2019 | $2,925 | $159,010 | $0 | $0 |
| 2018 | $2,789 | $154,380 | $0 | $0 |
| 2017 | $2,676 | $149,890 | $0 | $0 |
| 2016 | $2,360 | $145,530 | $0 | $0 |
| 2015 | $2,309 | $141,300 | $0 | $0 |
| 2014 | $2,253 | $137,190 | $0 | $0 |
Source: Public Records
Map
Nearby Homes
- 1094 NE 22nd St
- 2259 NE Morlan Ave
- 2105 NE Cleveland Ave
- 865 NE 18th St
- 2068 NE Juniper Ct
- 2280 NE Hogan Dr Unit 5
- 2062 NE Hogan Dr Unit 26
- 1816 NE Elliott Place
- 2475 NE Spruce Ave
- 1802 NE Hogan Dr Unit 97
- 1556 NE 27th Terrace
- 1722 NE Hogan Dr Unit 103
- 535 NE 24th St
- 1920 NE View Ct
- 1700 NE Hogan Dr Unit 114
- 1812 NE 19th St Unit 27
- 1889 NE Beech Ave
- 450 NE 22nd St
- 1418 NE Hogan Dr
- 2593 NE Beech Ave
- 2140 NE Liberty Ave
- 2080 NE Liberty Ave
- 2093 NE Maple Ave
- 1383 NE 21st St
- 2040 NE Liberty Ave
- 1334 NE 22nd St
- 2121 NE Liberty Ave
- 2053 NE Maple Ave
- 2091 NE Liberty Ave
- 1364 NE 22nd St
- 2151 NE Liberty Ave
- 2061 NE Liberty Ave
- 1413 NE 21st St
- 2171 NE Liberty Ave
- 1371 NE 20th St
- 2000 NE Liberty Ave
- 1394 NE 22nd St
- 2021 NE Liberty Ave
- 1422 NE 21st St
- 2191 NE Liberty Ave