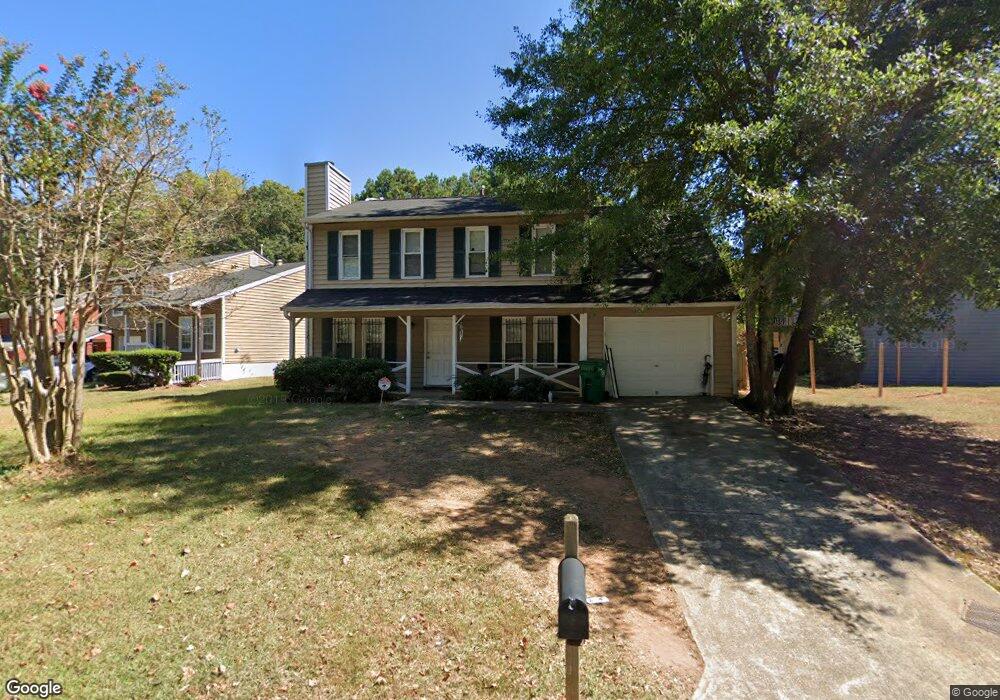
2100 Scarbrough Trail E Stone Mountain, GA 30088
Estimated Value: $243,000 - $270,114
4
Beds
3
Baths
2,088
Sq Ft
$123/Sq Ft
Est. Value
About This Home
This home is located at 2100 Scarbrough Trail E, Stone Mountain, GA 30088 and is currently estimated at $257,279, approximately $123 per square foot. 2100 Scarbrough Trail E is a home located in DeKalb County with nearby schools including Panola Way Elementary School, Miller Grove Middle School, and Miller Grove High School.
Ownership History
Date
Name
Owned For
Owner Type
Purchase Details
Closed on
Dec 23, 2014
Sold by
Arfan Muhammad
Bought by
Red Door Investment Fmt 2 Llc
Current Estimated Value
Purchase Details
Closed on
Mar 26, 2009
Sold by
Federal Natl Mtg Assn Fnma
Bought by
Muhammad Arfan Chand and Muhammad Arfan
Home Financials for this Owner
Home Financials are based on the most recent Mortgage that was taken out on this home.
Original Mortgage
$23,920
Interest Rate
5.1%
Mortgage Type
New Conventional
Purchase Details
Closed on
Oct 7, 2008
Sold by
Indymac Fsb
Bought by
Federal Natl Mtg Assn Fnma
Create a Home Valuation Report for This Property
The Home Valuation Report is an in-depth analysis detailing your home's value as well as a comparison with similar homes in the area
Home Values in the Area
Average Home Value in this Area
Purchase History
| Date | Buyer | Sale Price | Title Company |
|---|---|---|---|
| Red Door Investment Fmt 2 Llc | $55,000 | -- | |
| Muhammad Arfan Chand | -- | -- | |
| Federal Natl Mtg Assn Fnma | -- | -- | |
| Indymac Bk Fsb | $113,781 | -- |
Source: Public Records
Mortgage History
| Date | Status | Borrower | Loan Amount |
|---|---|---|---|
| Previous Owner | Muhammad Arfan Chand | $23,920 |
Source: Public Records
Tax History Compared to Growth
Tax History
| Year | Tax Paid | Tax Assessment Tax Assessment Total Assessment is a certain percentage of the fair market value that is determined by local assessors to be the total taxable value of land and additions on the property. | Land | Improvement |
|---|---|---|---|---|
| 2024 | $5,349 | $111,960 | $16,000 | $95,960 |
| 2023 | $5,349 | $94,560 | $8,800 | $85,760 |
| 2022 | $2,454 | $48,000 | $6,000 | $42,000 |
| 2021 | $2,454 | $48,000 | $6,000 | $42,000 |
| 2020 | $2,547 | $50,120 | $6,000 | $44,120 |
| 2019 | $2,438 | $47,640 | $6,000 | $41,640 |
| 2018 | $1,247 | $21,975 | $3,296 | $18,679 |
| 2017 | $1,348 | $21,976 | $3,296 | $18,680 |
| 2016 | $1,318 | $21,976 | $3,296 | $18,680 |
| 2014 | $1,371 | $22,600 | $4,000 | $18,600 |
Source: Public Records
Map
Nearby Homes
- 5220 Brough Ln
- 2235 Scarbrough Dr
- 2092 Countydown Ln
- 2080 Countydown Ln
- 5208 Shawn Ln
- 5207 Shawn Ln
- 2036 Countydown Ln
- 2045 Scarbrough Dr
- 2142 Arnage Dr
- 5350 Olde St
- 5317 Bentayga Dr
- 5323 Scarbrough Round
- 2230 Mulsanne Dr
- 2236 Windward Dr
- 2102 Moss Hill Rd
- 2100 Moss Hill Rd
- 2098 Moss Hill Rd
- 2073 Crossing Rd
- 2075 Crossing Rd
- 2077 Crossing Rd
- 2094 Scarbrough Trail E
- 5220 Scarbrough Ln Unit 95
- 5220 Scarbrough Ln
- 2090 Scarbrough Trail E
- 0 E Scarbrough Trail Unit 3229923
- 0 E Scarbrough Trail Unit 7339118
- 0 E Scarbrough Trail Unit 7252703
- 0 E Scarbrough Trail Unit 7169561
- 0 E Scarbrough Trail
- E E Scarbrough Trail Unit 5
- E E Scarbrough Trail
- 2095 Scarbrough Trail E
- 5208 Scarbrough Trail W
- 2086 Scarbrough Trail E
- 5206 Scarbrough Ln
- 5217 Scarbrough Ln
- 2193 Scarbrough Dr
- 5223 Scarbrough Ln
- 2085 Scarbrough Trail E
- 5201 Scarbrough Trail W