2100 Tanglewilde St Unit 251 Houston, TX 77063
Mid West NeighborhoodEstimated Value: $119,539 - $128,000
1
Bed
2
Baths
1,000
Sq Ft
$124/Sq Ft
Est. Value
About This Home
This home is located at 2100 Tanglewilde St Unit 251, Houston, TX 77063 and is currently estimated at $123,635, approximately $123 per square foot. 2100 Tanglewilde St Unit 251 is a home located in Harris County with nearby schools including Emerson Elementary School, Paul Revere Middle School, and Wisdom High School.
Ownership History
Date
Name
Owned For
Owner Type
Purchase Details
Closed on
Nov 1, 2013
Sold by
Holsenbeck Lee
Bought by
Persons Nathan Ross
Current Estimated Value
Purchase Details
Closed on
Aug 13, 2013
Sold by
Martin Elizabeth Anne
Bought by
Holsenbeck Lee
Purchase Details
Closed on
May 15, 2007
Sold by
Bank Of New York
Bought by
Martin Elizabeth Anne
Home Financials for this Owner
Home Financials are based on the most recent Mortgage that was taken out on this home.
Original Mortgage
$49,500
Interest Rate
6.37%
Mortgage Type
Purchase Money Mortgage
Purchase Details
Closed on
Nov 7, 2006
Sold by
Michaels Patricia V
Bought by
Bank Of New York and Certificateholders Cwabs Inc Asset Backe
Purchase Details
Closed on
Oct 18, 2006
Sold by
Woodlake Lp
Bought by
The Oaks Condominium Assn
Create a Home Valuation Report for This Property
The Home Valuation Report is an in-depth analysis detailing your home's value as well as a comparison with similar homes in the area
Home Values in the Area
Average Home Value in this Area
Purchase History
| Date | Buyer | Sale Price | Title Company |
|---|---|---|---|
| Persons Nathan Ross | -- | None Available | |
| Holsenbeck Lee | -- | Stewart Title Houston Divi | |
| Martin Elizabeth Anne | -- | United Title Of Texas | |
| Bank Of New York | $67,452 | None Available | |
| The Oaks Condominium Assn | -- | None Available |
Source: Public Records
Mortgage History
| Date | Status | Borrower | Loan Amount |
|---|---|---|---|
| Previous Owner | Martin Elizabeth Anne | $49,500 |
Source: Public Records
Tax History Compared to Growth
Tax History
| Year | Tax Paid | Tax Assessment Tax Assessment Total Assessment is a certain percentage of the fair market value that is determined by local assessors to be the total taxable value of land and additions on the property. | Land | Improvement |
|---|---|---|---|---|
| 2025 | $2,365 | $124,266 | $23,611 | $100,655 |
| 2024 | $2,365 | $135,188 | $25,686 | $109,502 |
| 2023 | $2,365 | $128,357 | $24,388 | $103,969 |
| 2022 | $2,349 | $106,695 | $20,272 | $86,423 |
| 2021 | $2,286 | $98,089 | $18,637 | $79,452 |
| 2020 | $2,375 | $98,089 | $18,637 | $79,452 |
| 2019 | $2,482 | $98,089 | $18,637 | $79,452 |
| 2018 | $2,411 | $95,269 | $18,101 | $77,168 |
| 2017 | $2,409 | $95,269 | $18,101 | $77,168 |
| 2016 | $2,409 | $95,269 | $18,101 | $77,168 |
| 2015 | $1,872 | $81,745 | $15,532 | $66,213 |
| 2014 | $1,872 | $72,833 | $13,838 | $58,995 |
Source: Public Records
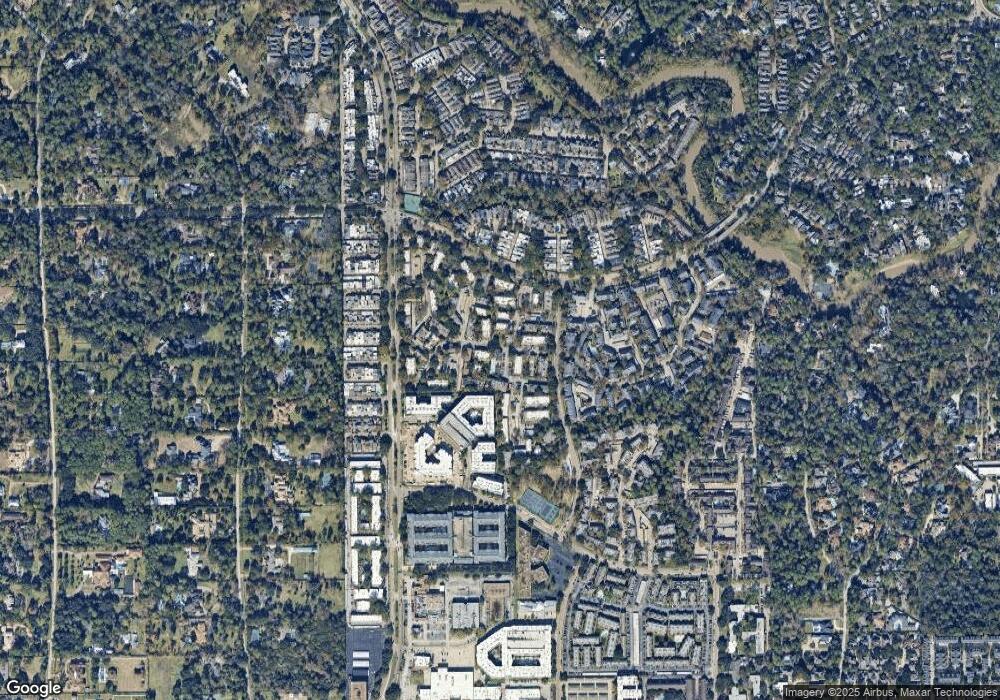
Map
Nearby Homes
- 2100 Tanglewilde St Unit 131
- 2100 Tanglewilde St Unit 282
- 2100 Tanglewilde St Unit 299
- 2100 Tanglewilde St Unit 297
- 2100 Tanglewilde St Unit 169
- 2100 Tanglewilde St Unit 378
- 2100 Tanglewilde St Unit 250
- 2100 Tanglewilde St Unit 455
- 2100 Tanglewilde St Unit 536
- 2100 Tanglewilde St Unit 402
- 2100 Tanglewilde St Unit 705
- 2100 Tanglewilde St Unit 312
- 2100 Tanglewilde St Unit 349
- 2100 Tanglewilde St Unit 684
- 9380 Briar Forest Dr
- 9378 Briar Forest Dr
- 9476 Briar Forest Dr
- 9620 Doliver Dr
- 30 E Rivercrest Dr
- 9574 Doliver Dr
- 2100 Tanglewilde St Unit 211
- 2100 Tanglewilde St Unit 310
- 2100 Tanglewilde St Unit 324
- 2100 Tanglewilde St Unit 499
- 2100 Tanglewilde St Unit 699
- 2100 Tanglewilde St Unit 517
- 2100 Tanglewilde St Unit 282
- 2100 Tanglewilde St Unit 457
- 2100 Tanglewilde St Unit 248
- 2100 Tanglewilde St Unit 284
- 2100 Tanglewilde St Unit 453
- 2100 Tanglewilde St Unit 312
- 2100 Tanglewilde St Unit 325
- 2100 Tanglewilde St Unit 276
- 2100 Tanglewilde St Unit 558
- 2100 Tanglewilde St Unit 95
- 2100 Tanglewilde St Unit 127
- 2100 Tanglewilde St Unit 578
- 2100 Tanglewilde St Unit 475
- 2100 Tanglewilde St Unit 131