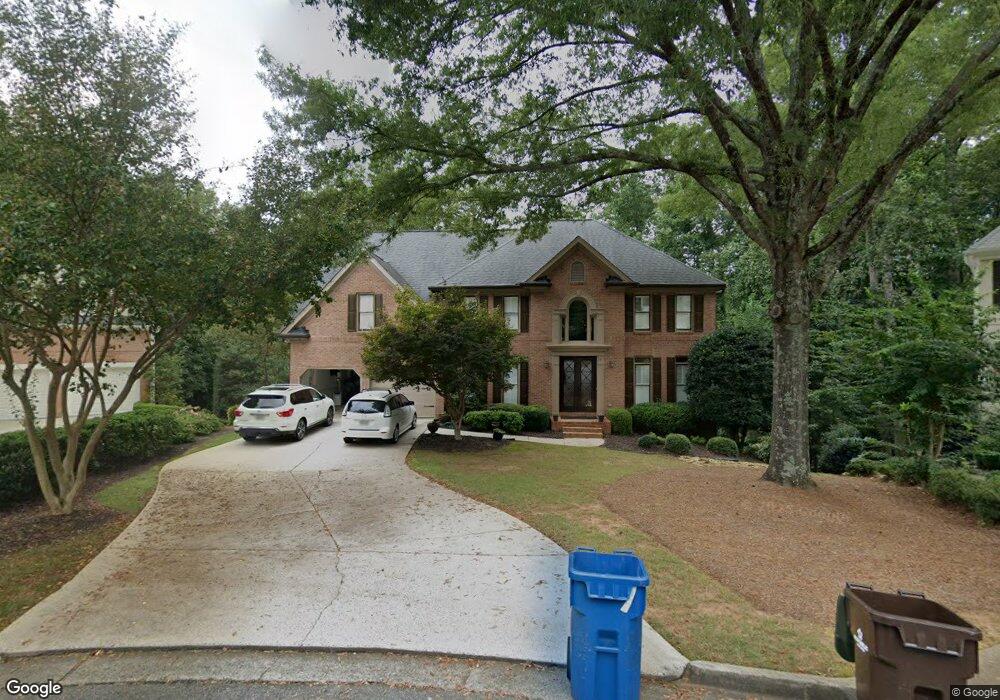
2100 Walnut Creek Crossing Alpharetta, GA 30005
Windward NeighborhoodEstimated Value: $799,447 - $942,000
5
Beds
4
Baths
3,590
Sq Ft
$249/Sq Ft
Est. Value
About This Home
This home is located at 2100 Walnut Creek Crossing, Alpharetta, GA 30005 and is currently estimated at $895,112, approximately $249 per square foot. 2100 Walnut Creek Crossing is a home located in Fulton County with nearby schools including Creek View Elementary School, Webb Bridge Middle School, and Alpharetta High School.
Ownership History
Date
Name
Owned For
Owner Type
Purchase Details
Closed on
May 9, 2011
Sold by
Hart Charles T and Hart Lisa M
Bought by
Carawan Rachel L and Carawan Leland W
Current Estimated Value
Home Financials for this Owner
Home Financials are based on the most recent Mortgage that was taken out on this home.
Original Mortgage
$305,696
Outstanding Balance
$211,955
Interest Rate
4.83%
Mortgage Type
New Conventional
Estimated Equity
$683,157
Purchase Details
Closed on
May 8, 2009
Sold by
Macdonald Janice M
Bought by
Hart Charles T and Hart Lisa M
Home Financials for this Owner
Home Financials are based on the most recent Mortgage that was taken out on this home.
Original Mortgage
$320,512
Interest Rate
4.79%
Mortgage Type
FHA
Purchase Details
Closed on
Sep 8, 1995
Sold by
Homesinc Jim Hogan
Bought by
Mcdonald David F Janice M
Create a Home Valuation Report for This Property
The Home Valuation Report is an in-depth analysis detailing your home's value as well as a comparison with similar homes in the area
Home Values in the Area
Average Home Value in this Area
Purchase History
| Date | Buyer | Sale Price | Title Company |
|---|---|---|---|
| Carawan Rachel L | $382,200 | -- | |
| Hart Charles T | $350,000 | -- | |
| Macdonald Janice M | -- | -- | |
| Mcdonald David F Janice M | $288,200 | -- |
Source: Public Records
Mortgage History
| Date | Status | Borrower | Loan Amount |
|---|---|---|---|
| Open | Carawan Rachel L | $305,696 | |
| Previous Owner | Macdonald Janice M | $320,512 | |
| Closed | Mcdonald David F Janice M | $0 |
Source: Public Records
Tax History Compared to Growth
Tax History
| Year | Tax Paid | Tax Assessment Tax Assessment Total Assessment is a certain percentage of the fair market value that is determined by local assessors to be the total taxable value of land and additions on the property. | Land | Improvement |
|---|---|---|---|---|
| 2025 | $899 | $222,640 | $52,040 | $170,600 |
| 2023 | $6,324 | $224,040 | $52,040 | $172,000 |
| 2022 | $4,492 | $224,040 | $52,040 | $172,000 |
| 2021 | $5,294 | $208,160 | $48,520 | $159,640 |
| 2020 | $5,322 | $199,920 | $37,960 | $161,960 |
| 2019 | $809 | $196,360 | $37,280 | $159,080 |
| 2018 | $4,852 | $191,800 | $36,440 | $155,360 |
| 2017 | $4,407 | $163,000 | $44,520 | $118,480 |
| 2016 | $4,406 | $163,000 | $44,520 | $118,480 |
| 2015 | $5,161 | $163,000 | $44,520 | $118,480 |
| 2014 | $4,248 | $151,320 | $41,320 | $110,000 |
Source: Public Records
Map
Nearby Homes
- 1065 Beacon Hill Crossing
- 12981 Dartmore Cir
- 13042 Dartmore Ave
- 1170 Greatwood Manor
- 1230 Greatwood Manor
- 425 Fieldstone Landing
- 2120 Blackheath Trace
- 10 Club Ct
- 2485 Hamptons Passage
- 1225 Bay Pointe Terrace
- 1200 Bay Pointe Terrace
- 2250 Blackheath Trace
- 7840 Willoughby Ct
- 1075 Carnoustie Ln
- 7845 Crownpoint Dr
- 7535 Jamestown Dr
- 6105 Harbour Overlook
- 12595 Huntington Trace
- 5370 McGinnis Ferry Rd
- 7875 Pierpoint Ln
- 2090 Walnut Creek Crossing
- 2095 Walnut Creek Crossing
- 2080 Walnut Creek Crossing
- 2085 Walnut Creek Crossing
- 1070 Graystone Crossing
- 1080 Graystone Crossing
- 1060 Graystone Crossing
- 2075 Walnut Creek Crossing
- 2070 Walnut Creek Crossing
- 5055 Walnut Creek Trail
- 200 Graystone Way
- 1050 Graystone Crossing
- 2065 Walnut Creek Crossing
- 2060 Walnut Creek Crossing
- 210 Graystone Way
- 5035 Walnut Creek Trail
- 1040 Graystone Crossing
- 5025 Walnut Creek Trail
- 2050 Walnut Creek Crossing
- 1030 Graystone Crossing